Debugging Suite
Debugging Suite is a tool designed to assist developers and testers in debugging and troubleshooting issues related to SDK integration and network testing within your application.
The suite provides three main features:
Open Debugging Suite
There are two ways to show the Debugging Suite: by registering a Test Device or by calling a method in your code.
Ensure the XMediator SDK has completed initialization before attempting to open the Debugging Suite. Opening it too early can result in the suite failing to launch or the app crashing.
Set up a Test Device
This option is suitable for production builds or for QA teams, where you don't have access to the code. To add your device as a Test Device, follow the steps below:
-
Obtain the IDFA (Identifier for Advertising) if you are in iOS or the GAID (Google Advertising ID) if you are in Android of your mobile device.
-
Login to https://admin.x3mads.com/ and go to the Test Devices section.
-
Add your device to the list and enable it for testing.
-
Open your App or Game with X3M integrated and initialized.
-
Shake your device, and a button to open Loomit's Debugging Suite should pop up in the lower-right corner.

Open Debugging Suite programmatically
To open the Debugging Suite programmatically, you can call the following method from the SDK:
auto* sdk = x3mads::XMediatorAds::getInstance();
sdk->openDebuggingSuite();
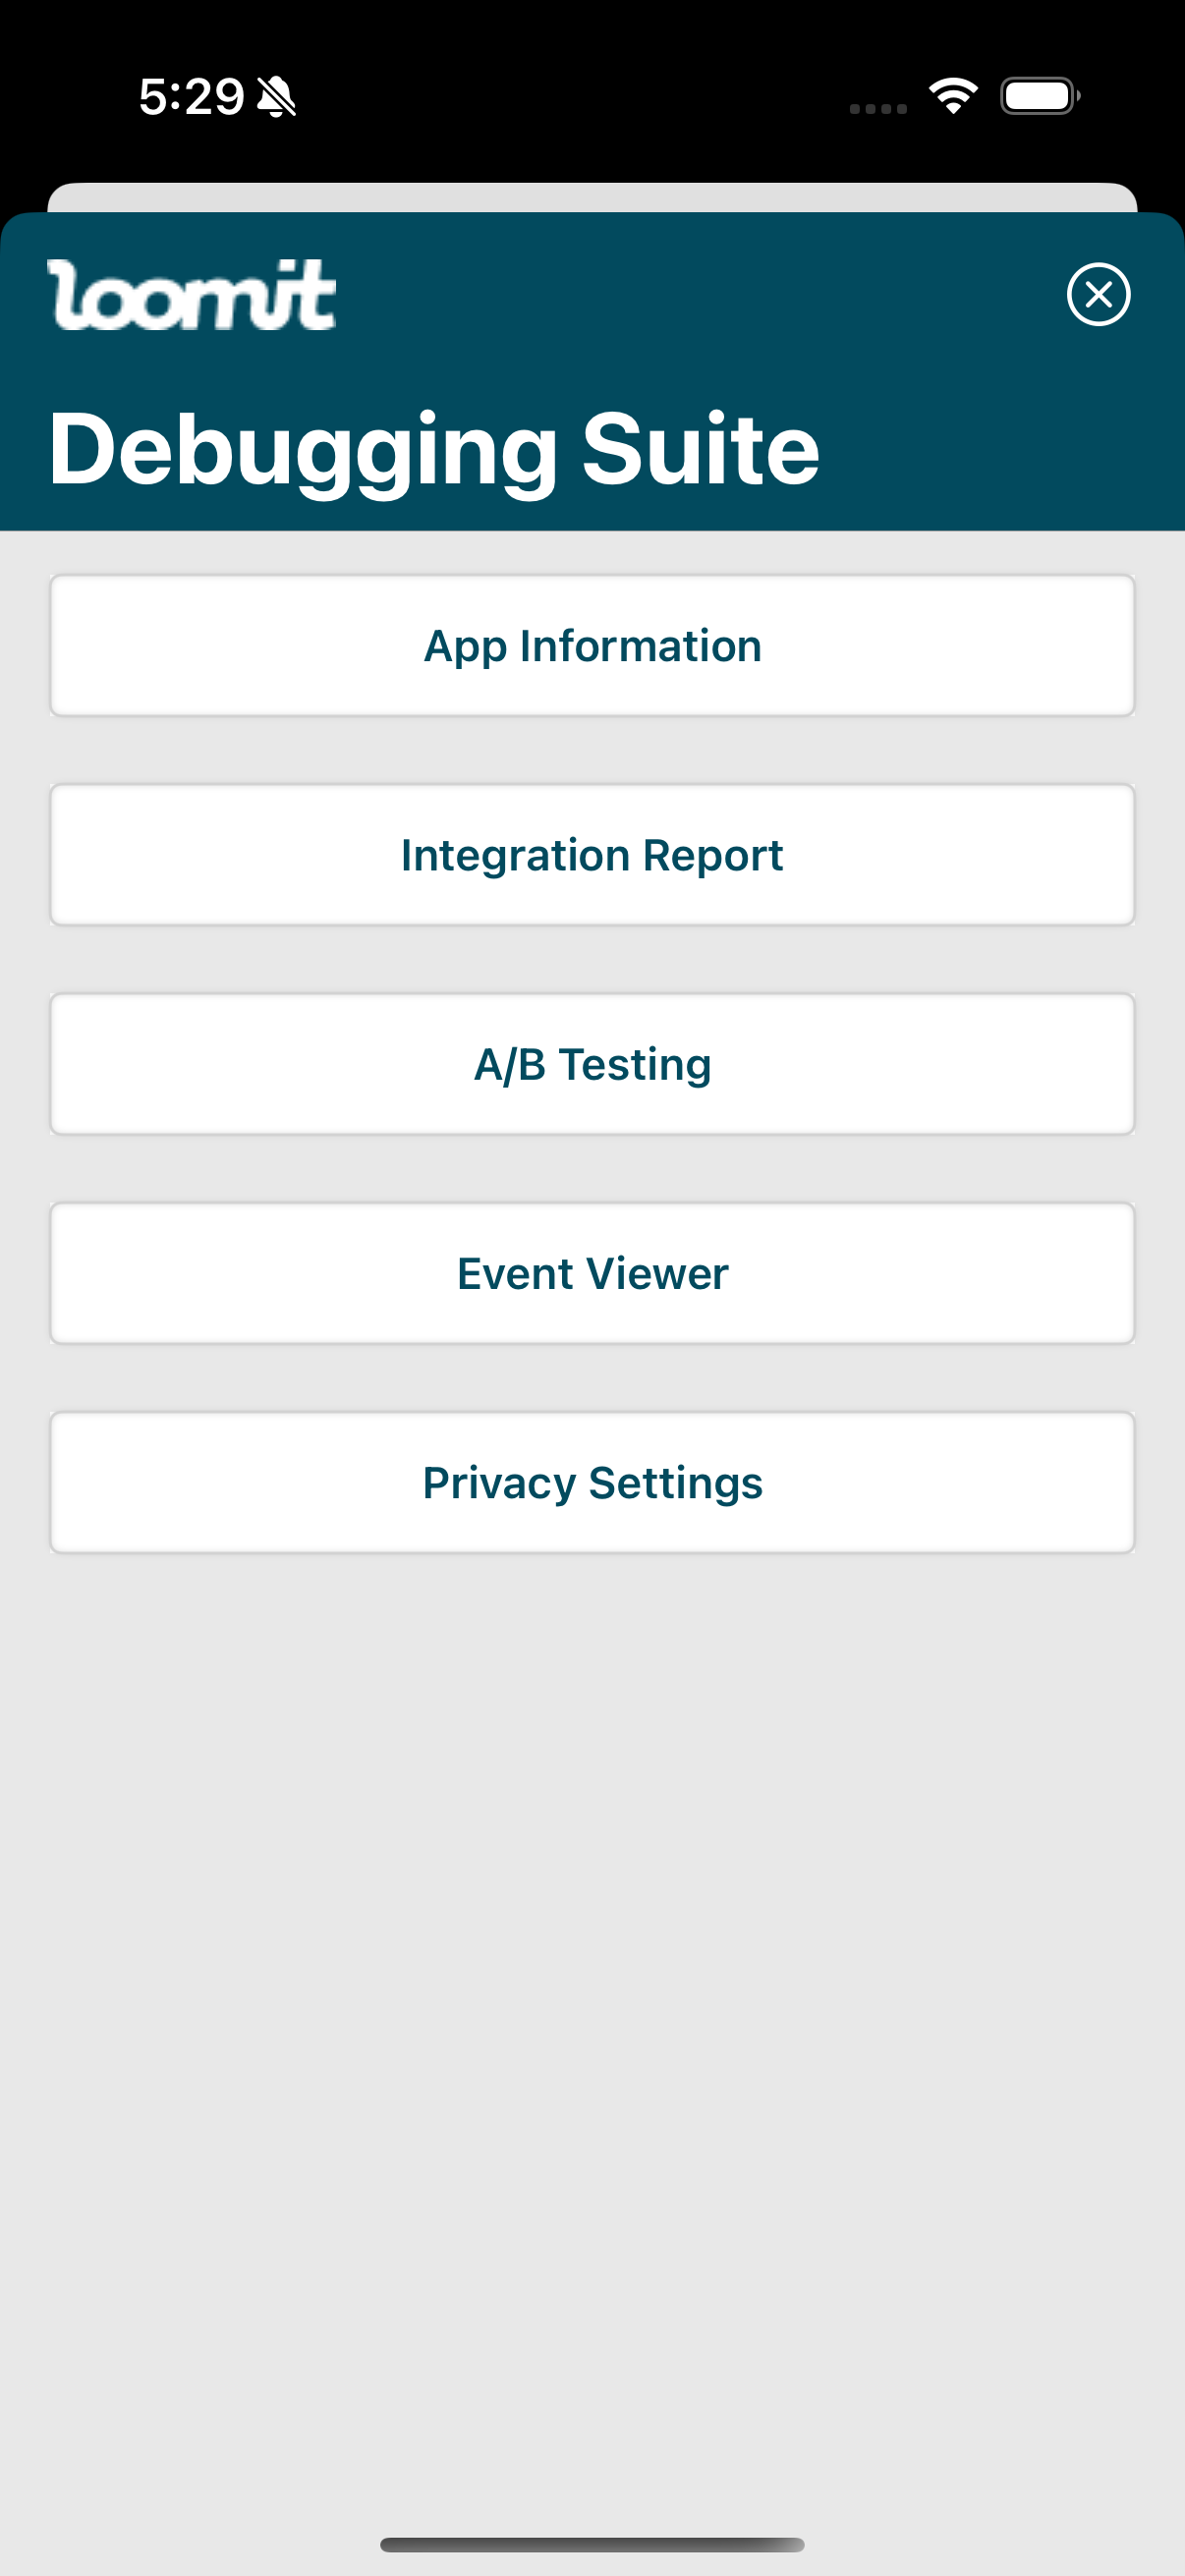
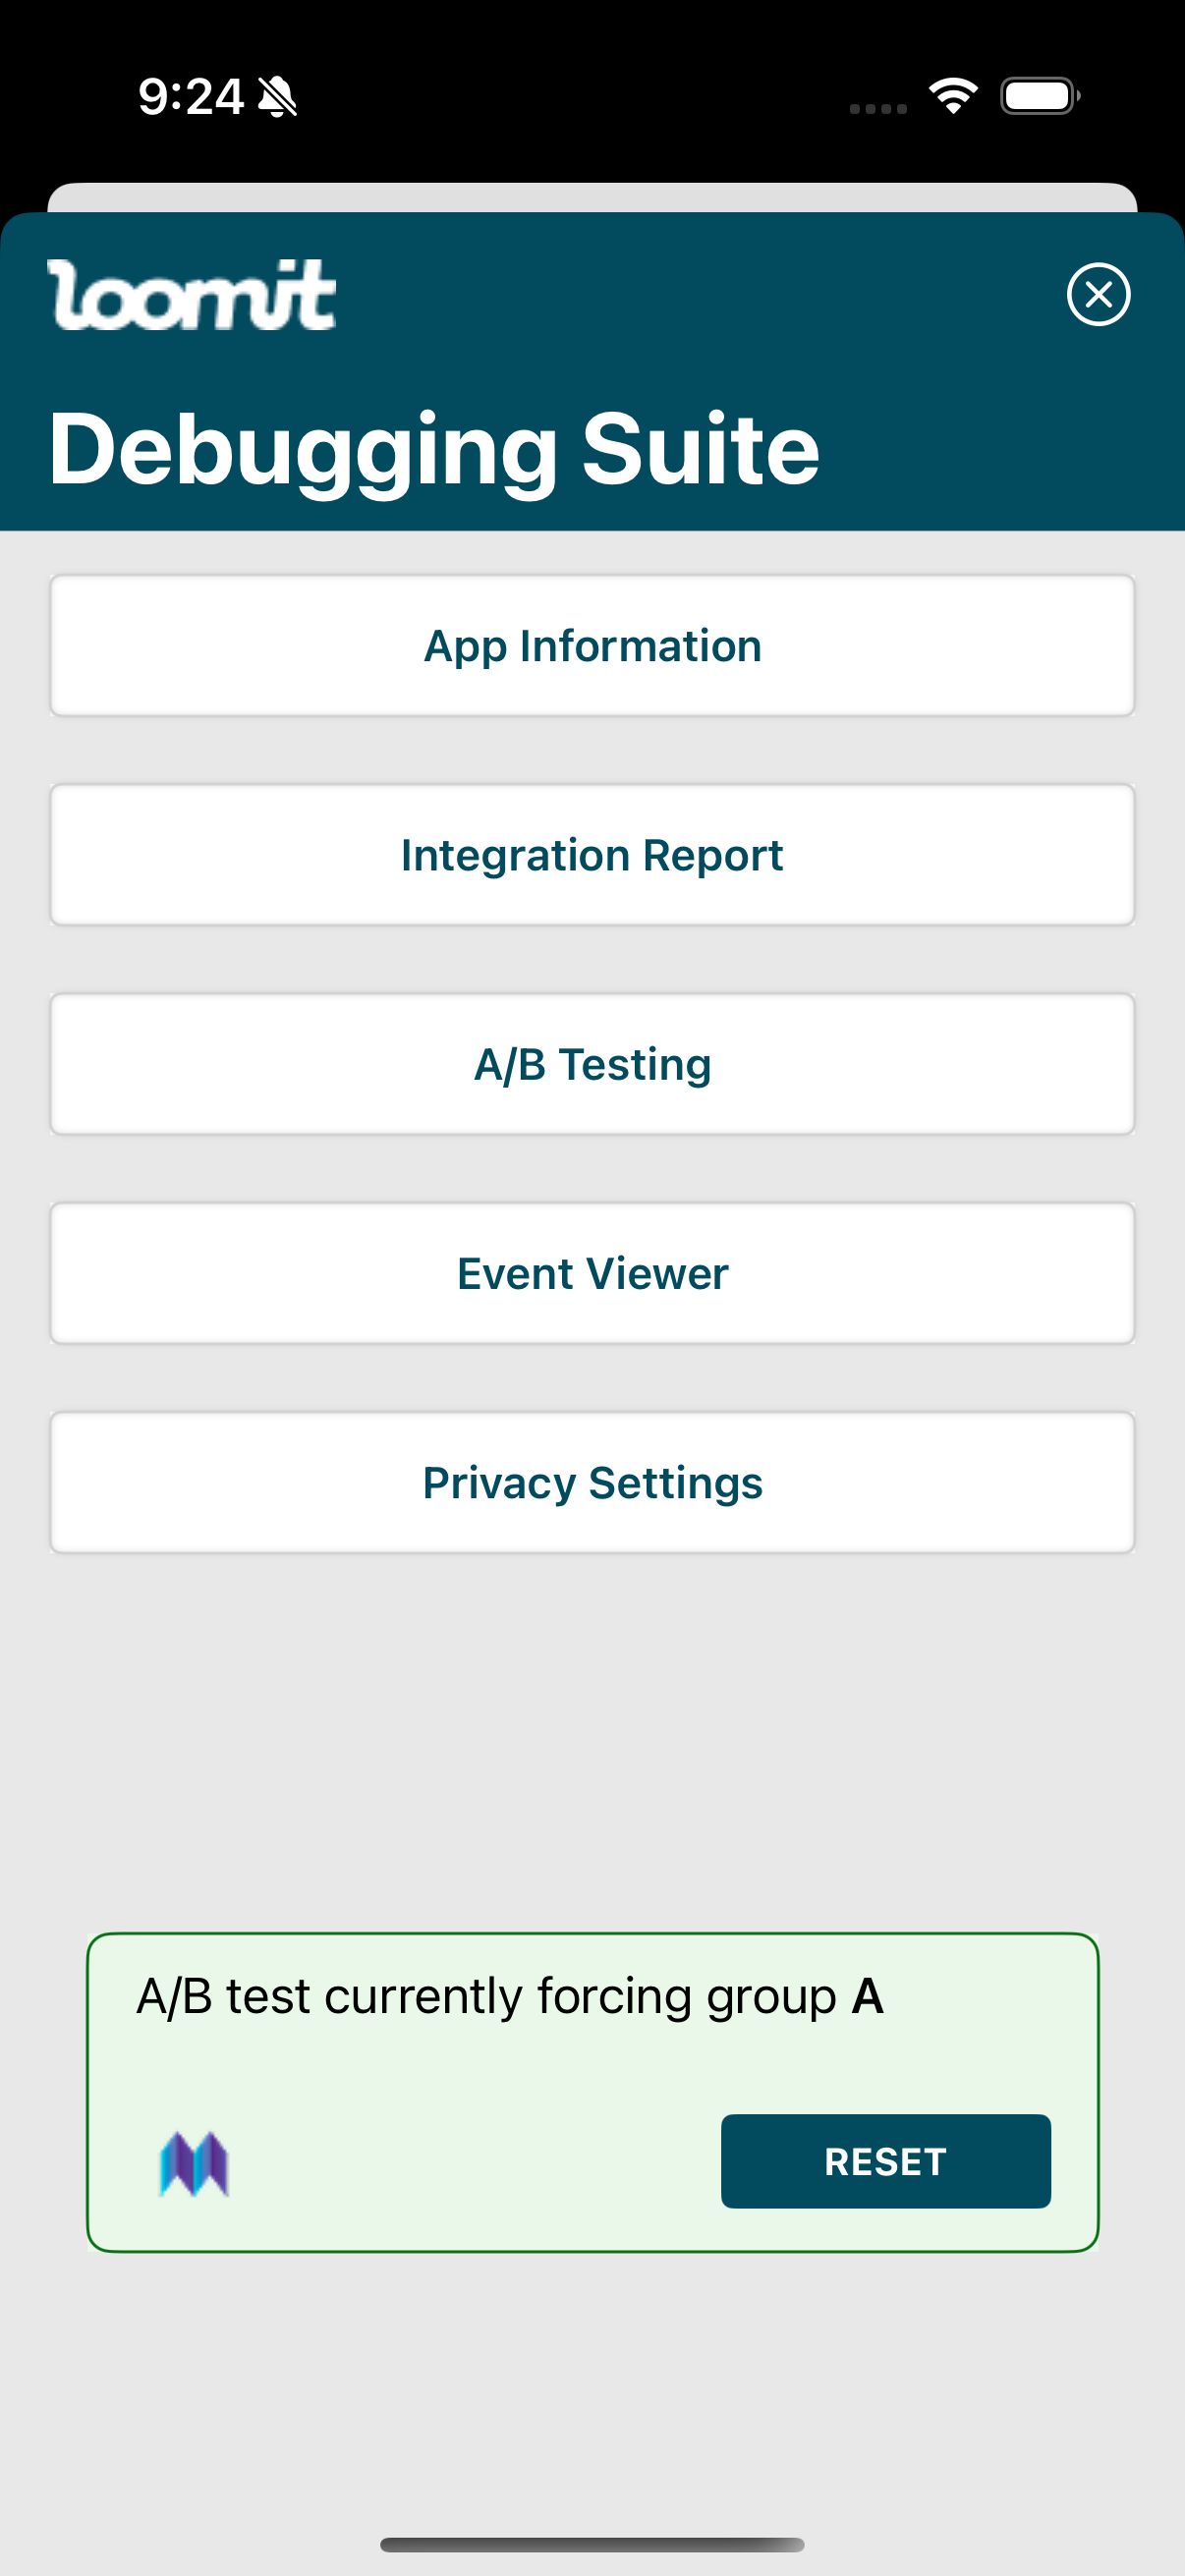
Debugging Suite Features
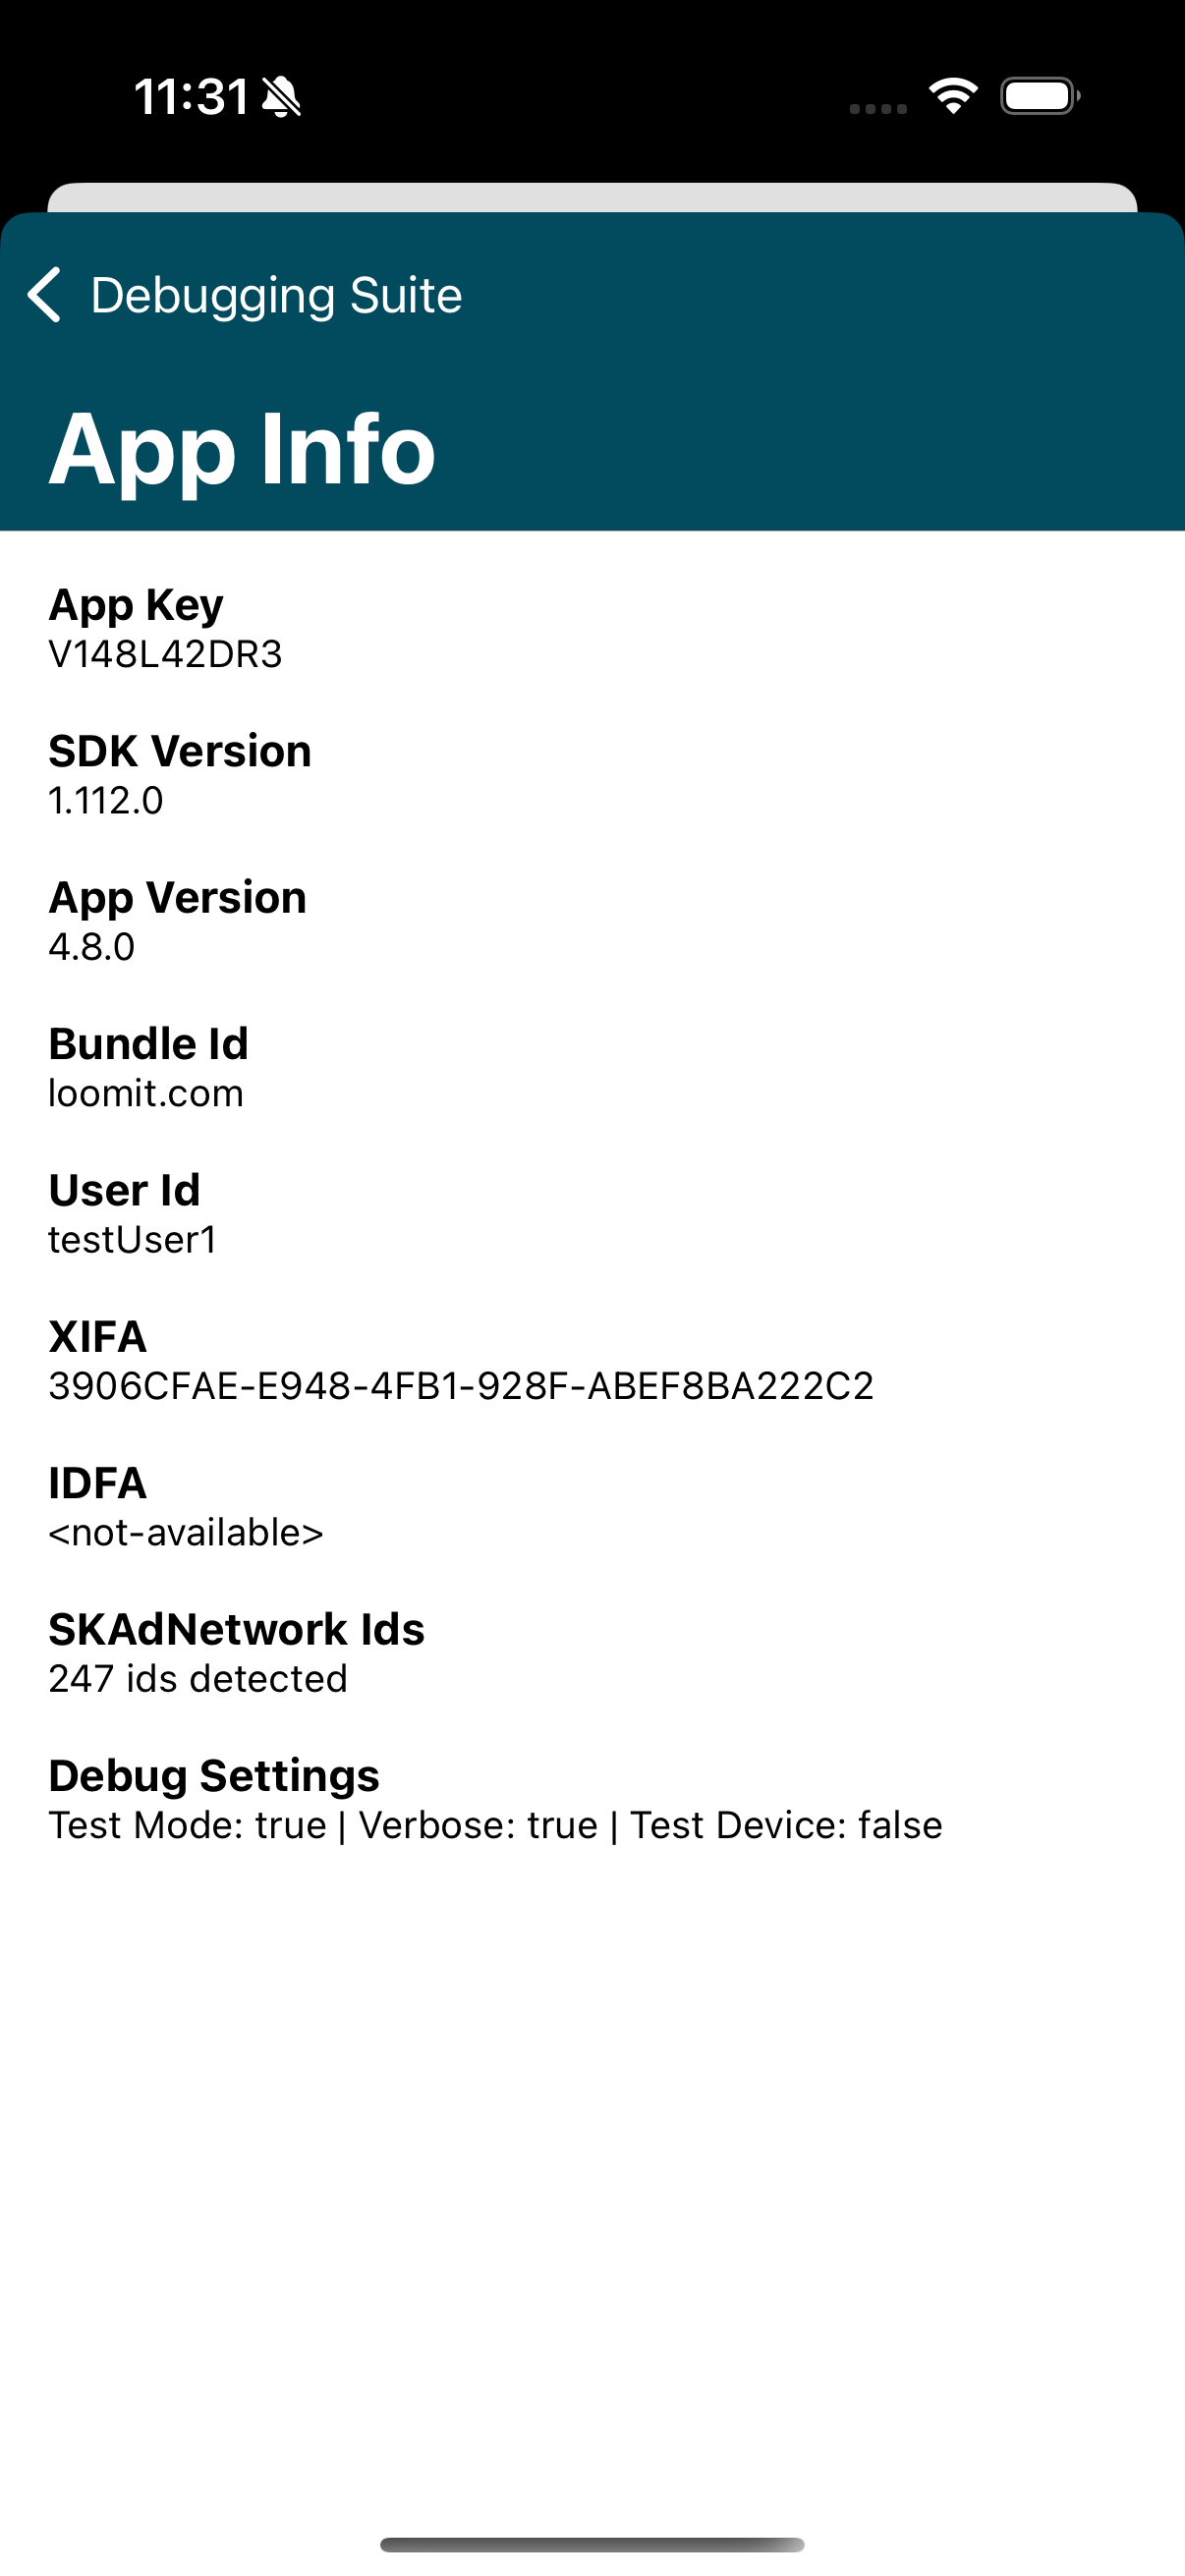
App Info
The App-Info feature offers quick access to essential SDK details, including the SDK version, initialization settings, and key identifiers.
Integration Report
The Integration Report feature helps identify potential integration issues, ensuring correct SDK integration within the app. It provides a list of network SDKs and adapters that are currently integrated for each mediation.
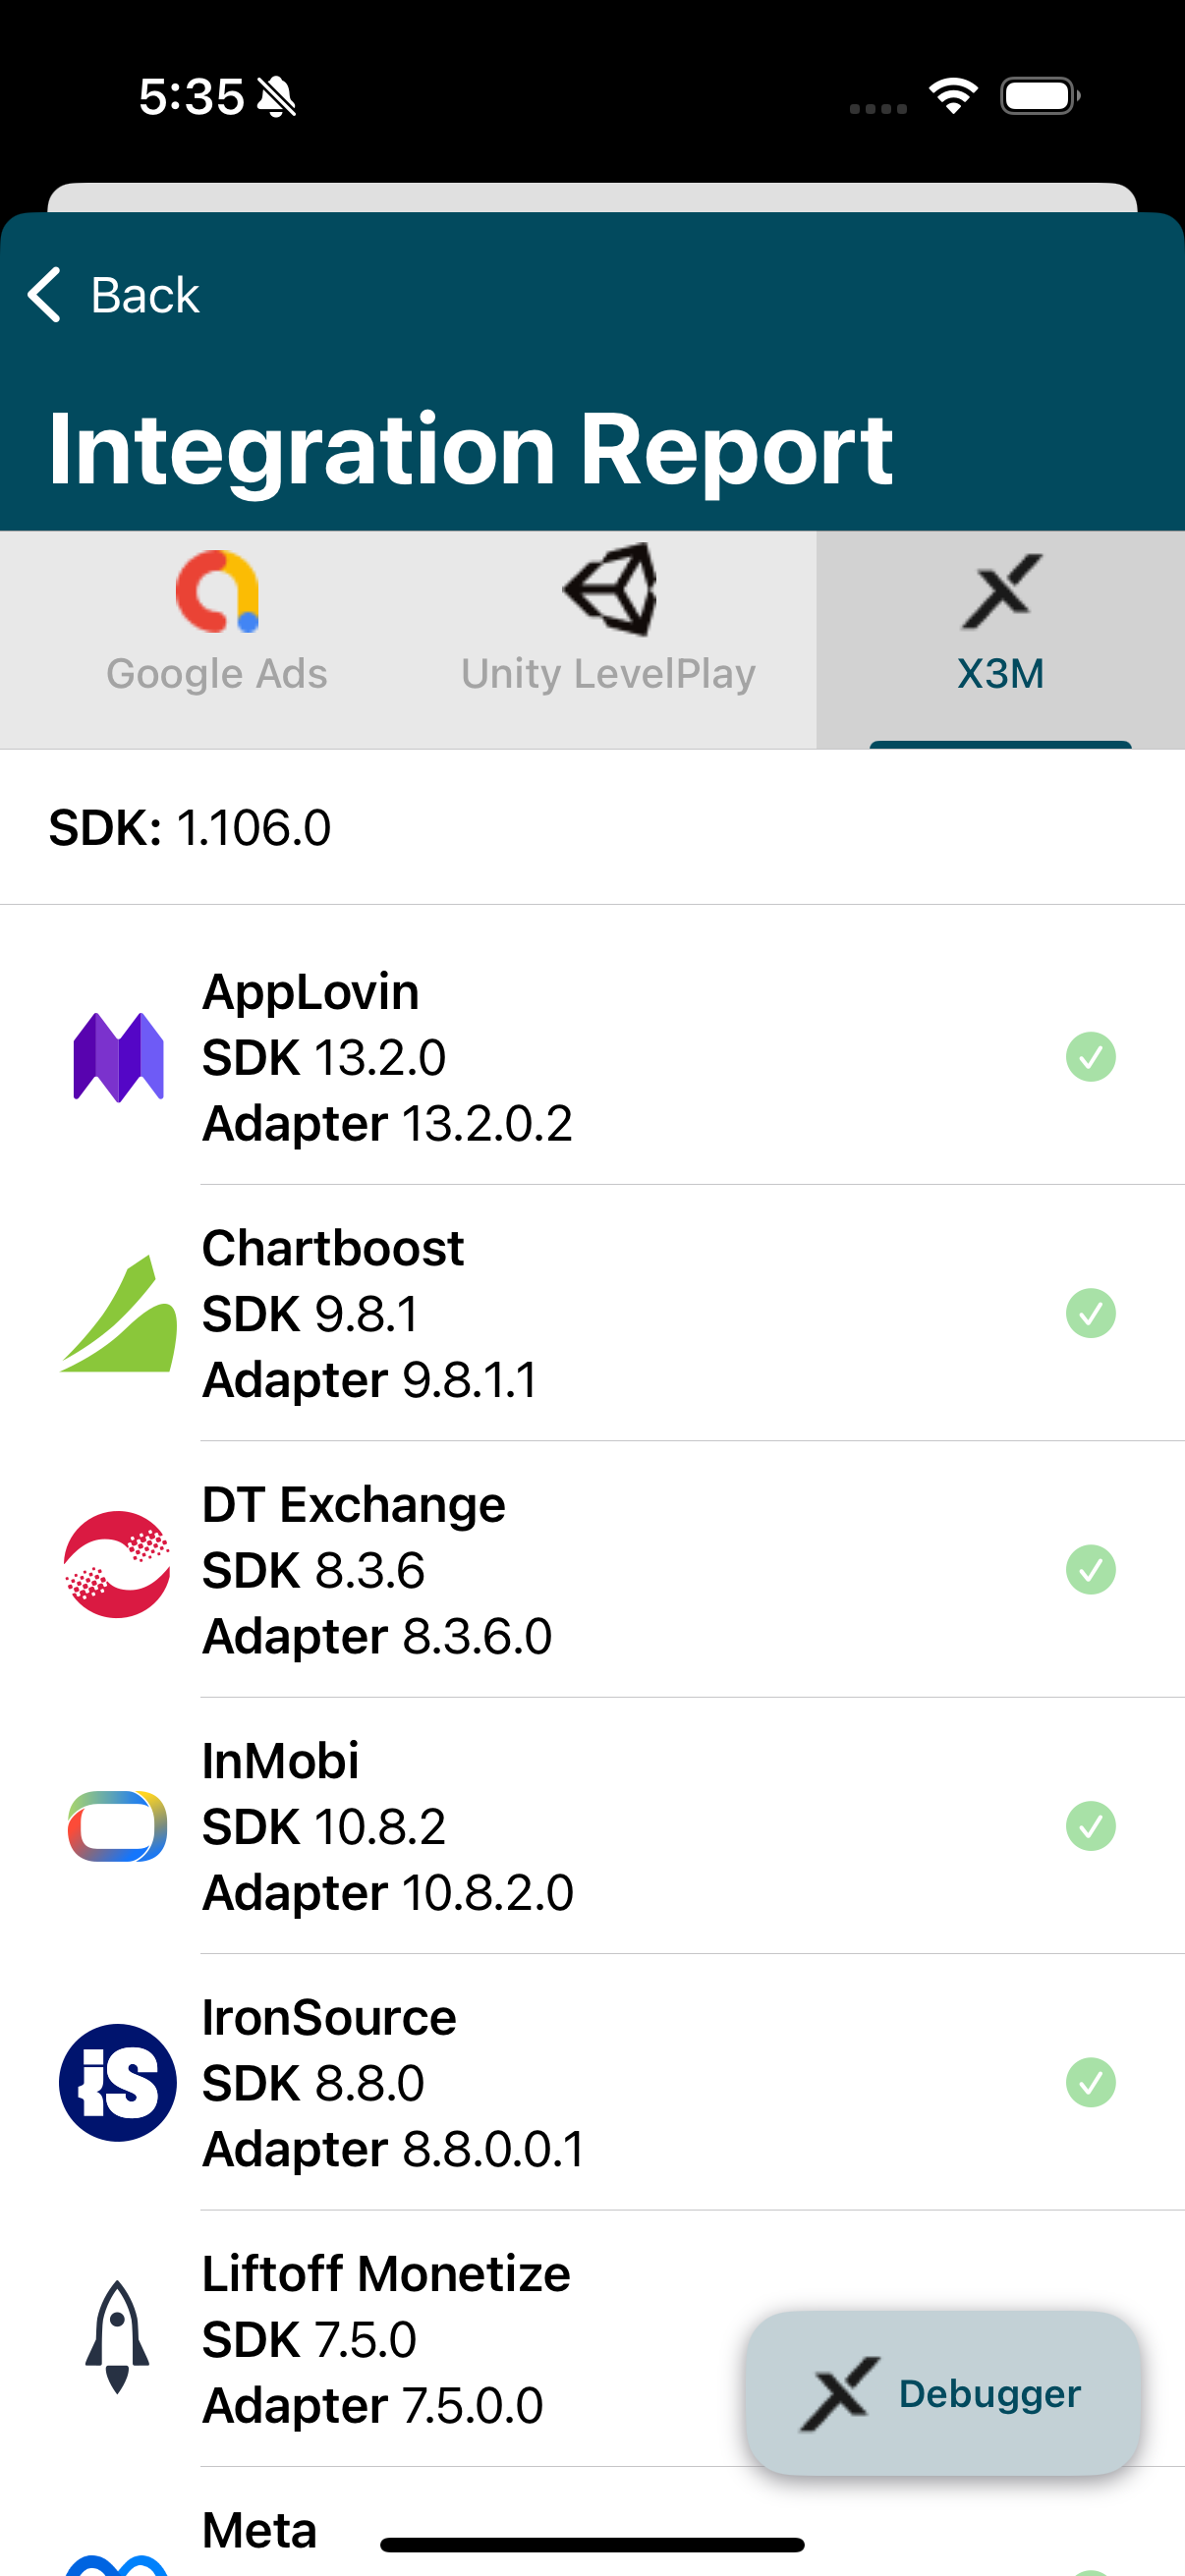
The Integration Report Status provides insight into SDK integration health:
- Integrated: Shows the adapter version and network SDK version, confirming proper integration.

- Missing Adapter: Marks adapters configured in admin but not integrated; requires adding the network adapter.

- Debugger: For each integrated mediation, you can access its own debugging tool using the Debugger button, streamlining the verification of integration and functionality.

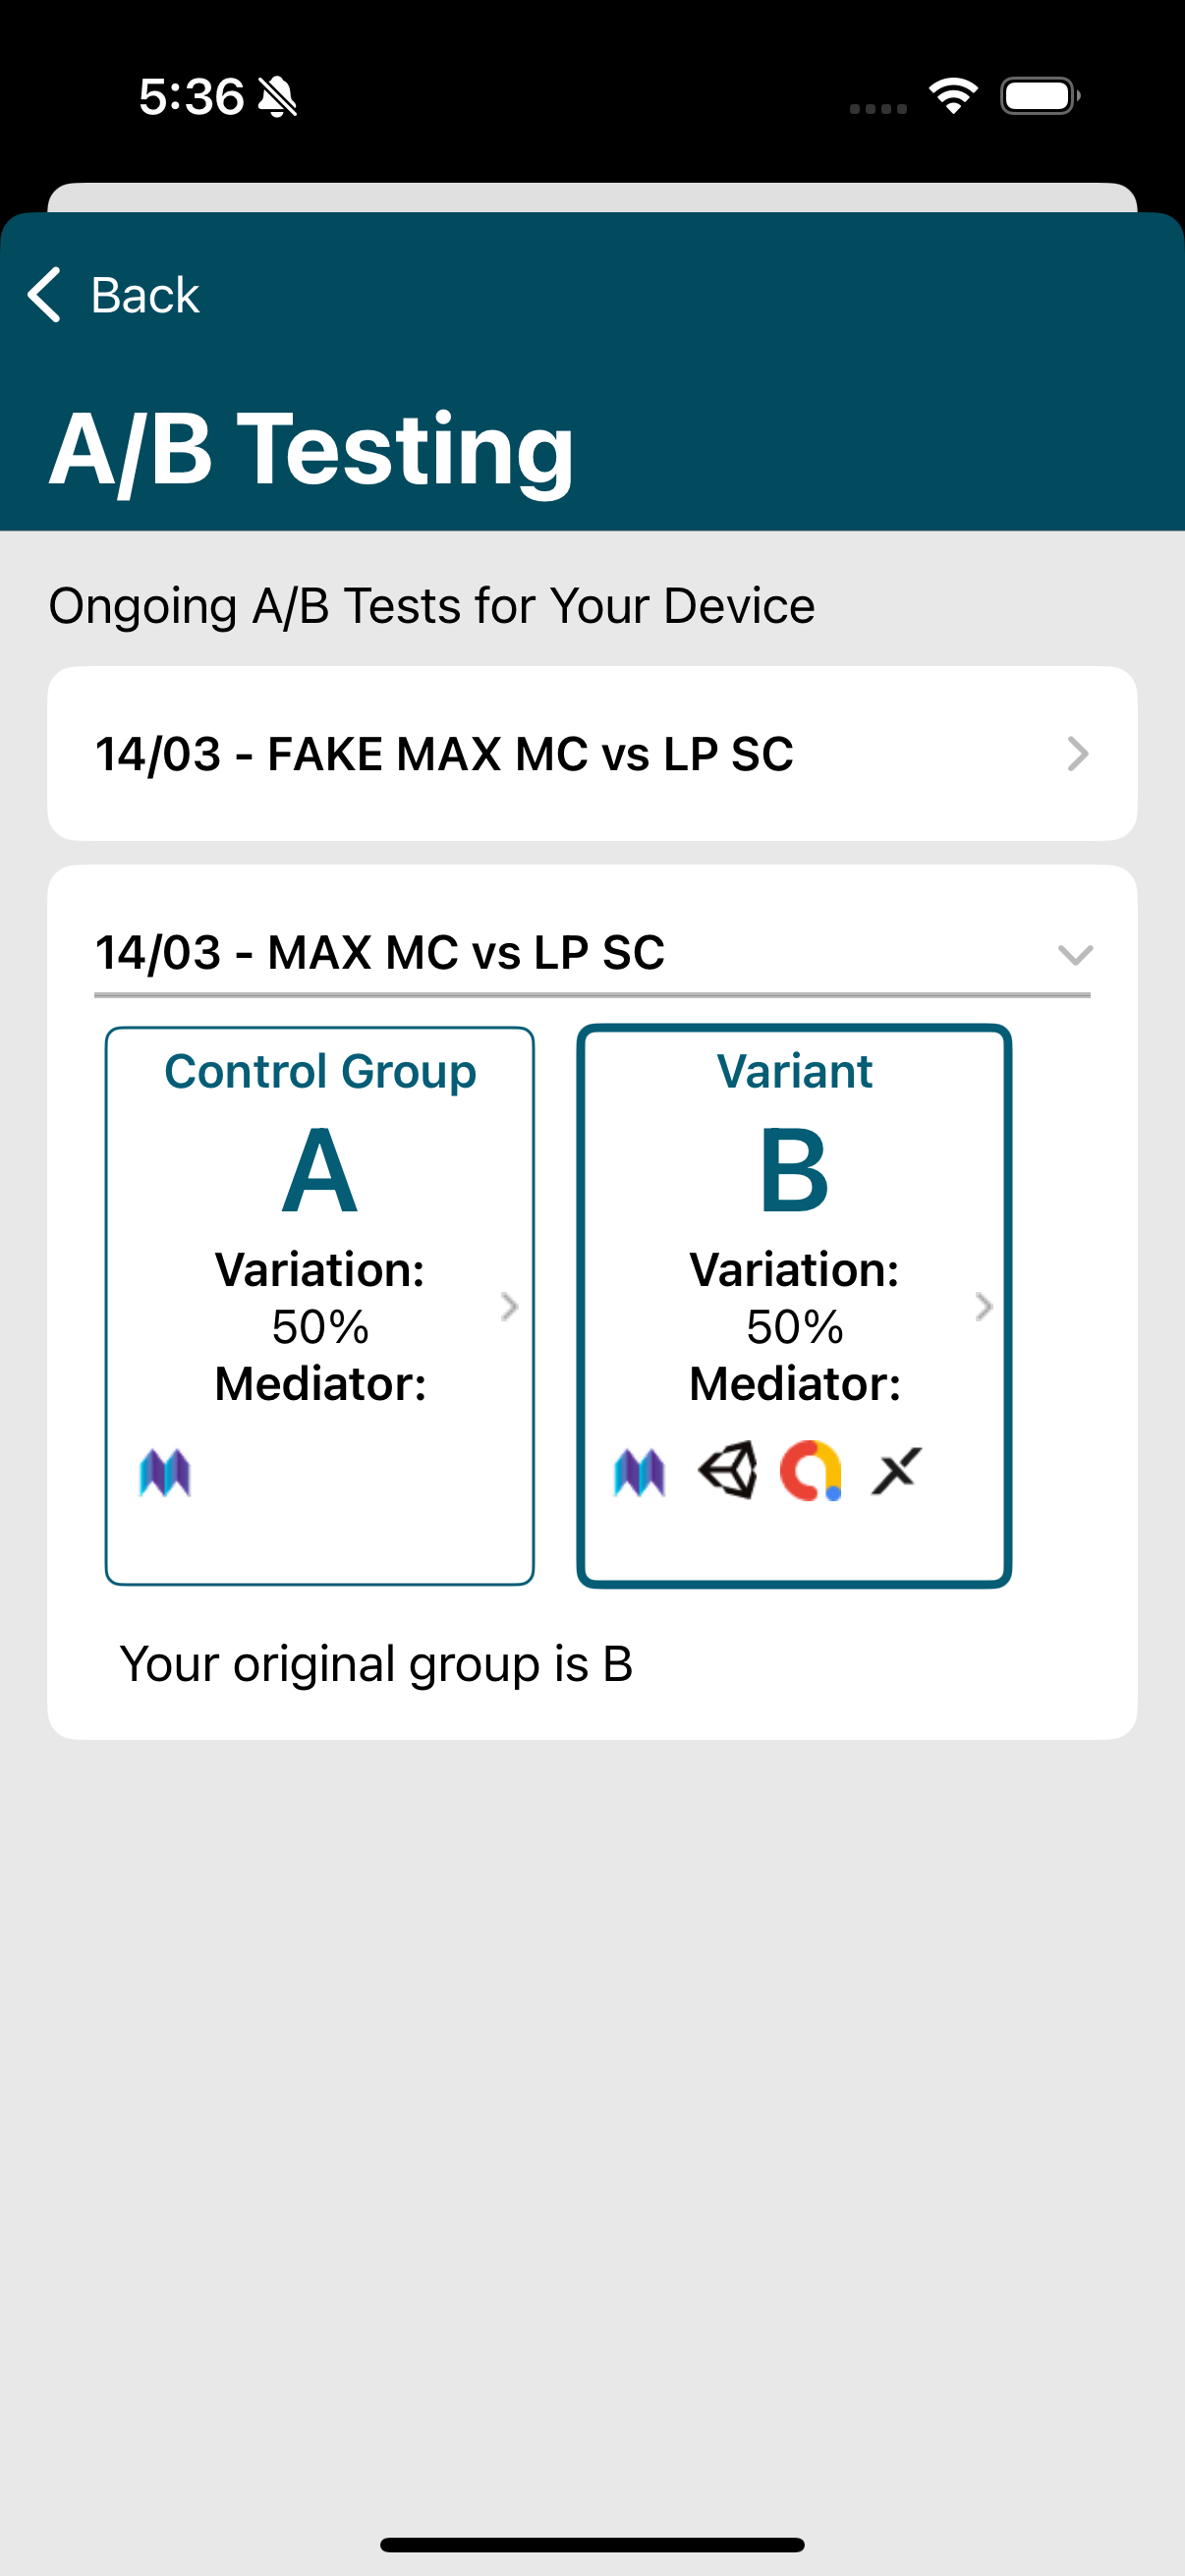
A/B Testing
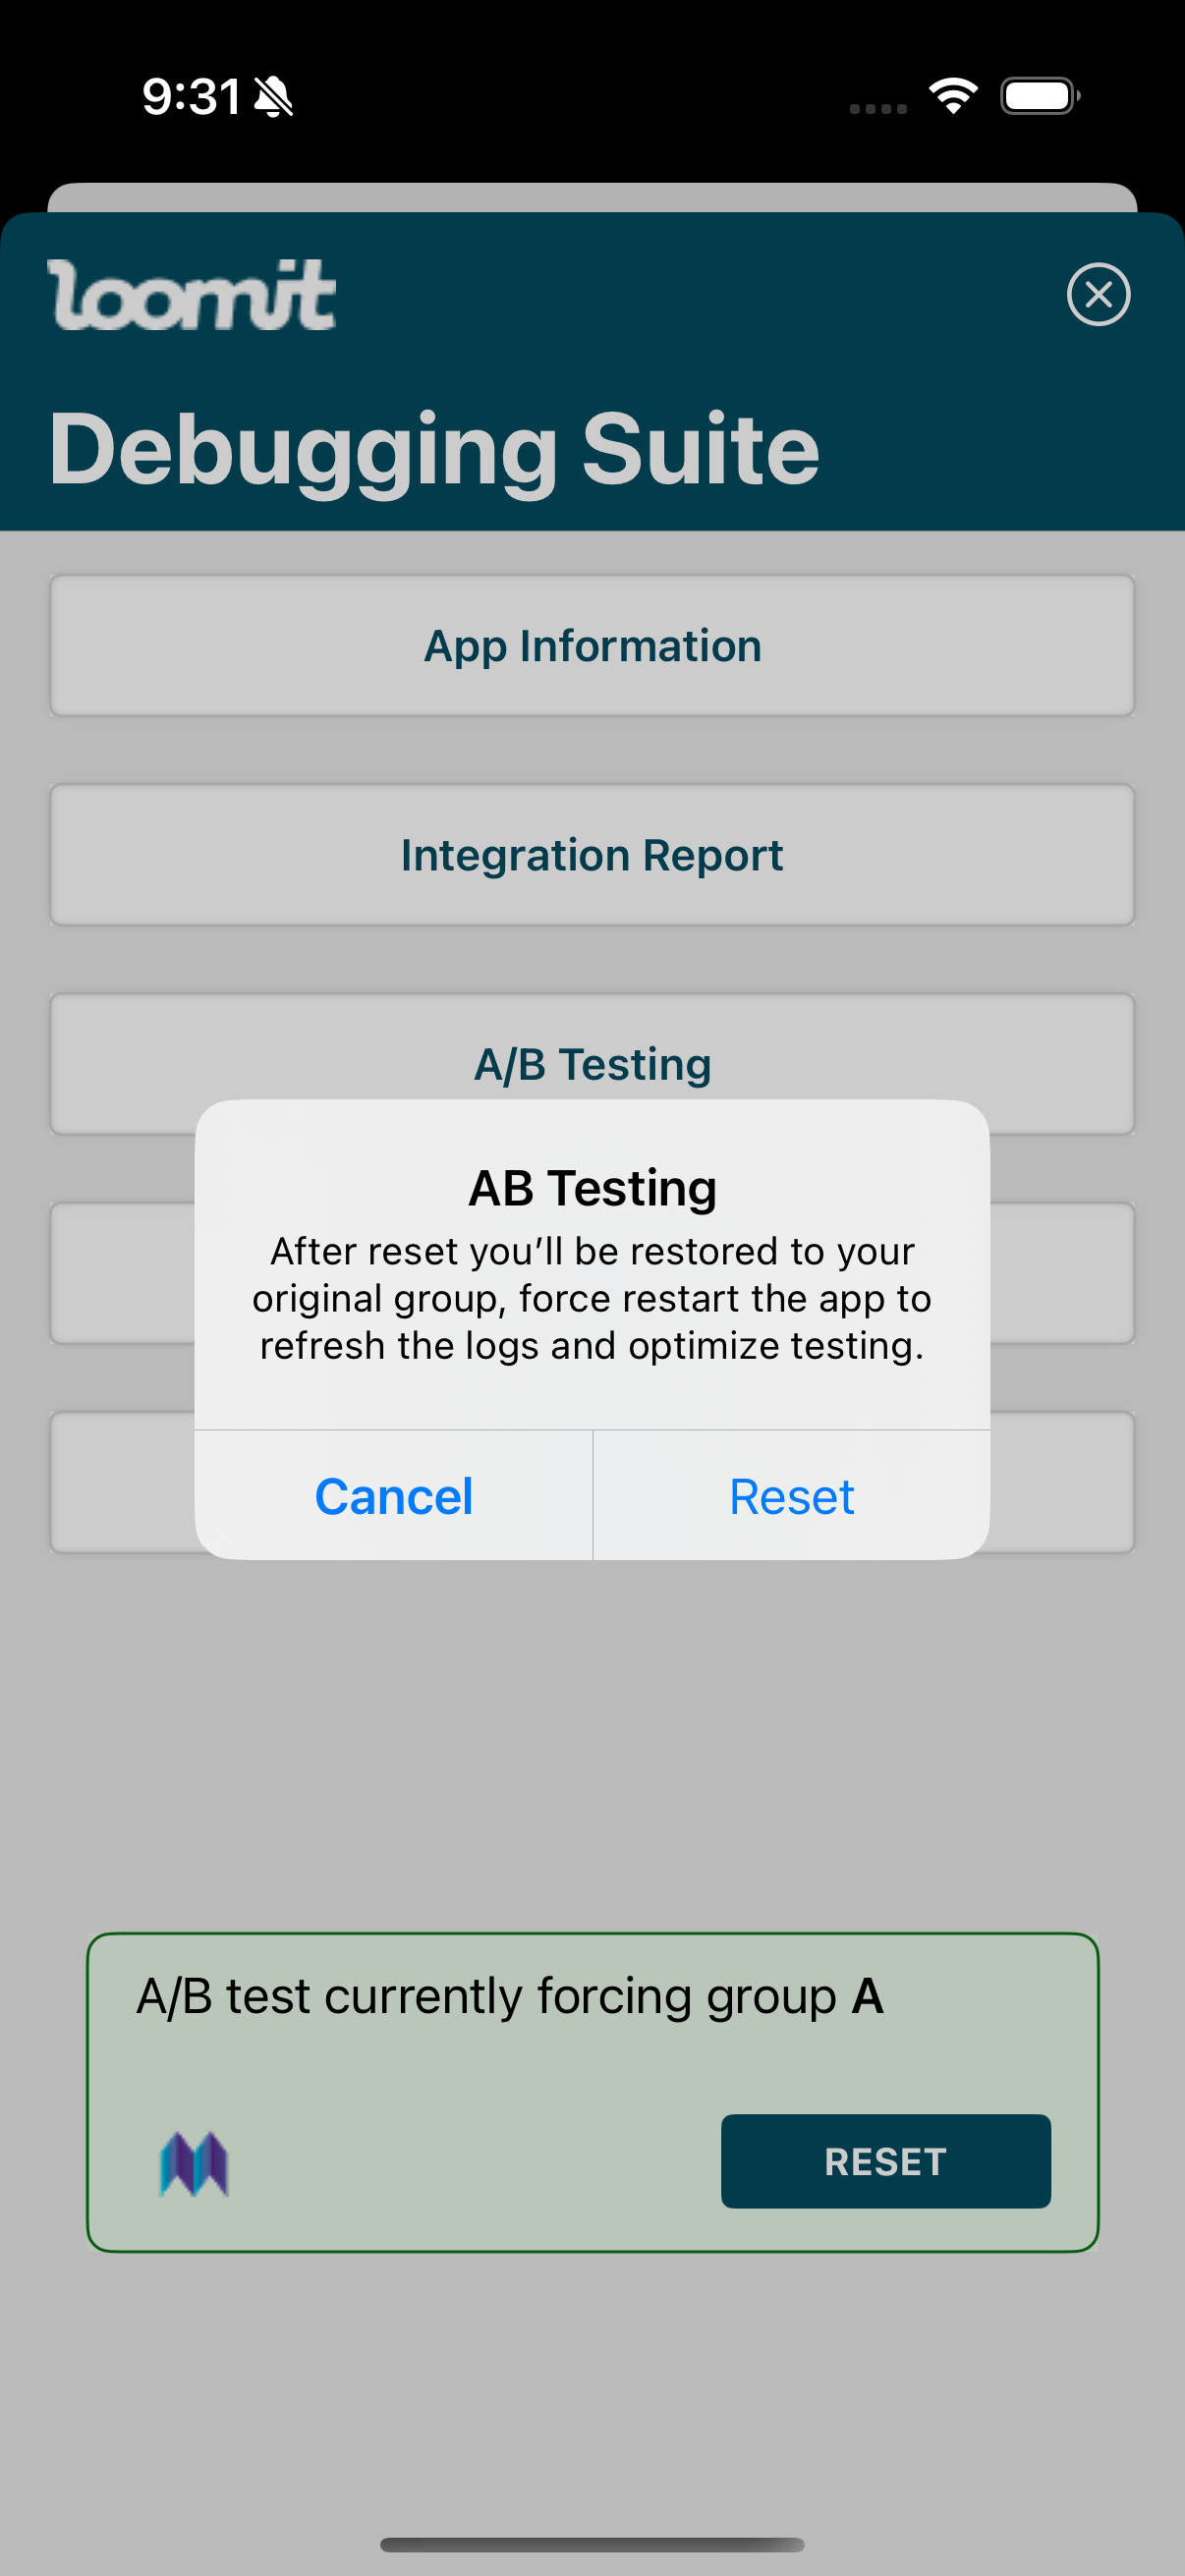
The A/B Testing feature shows the A/B tests that are running in your application, displays the default group for the current user, and allows you to force and change the group for the user.
To force a group of A/B tests, select one from the list, and a confirmation alert will appear.
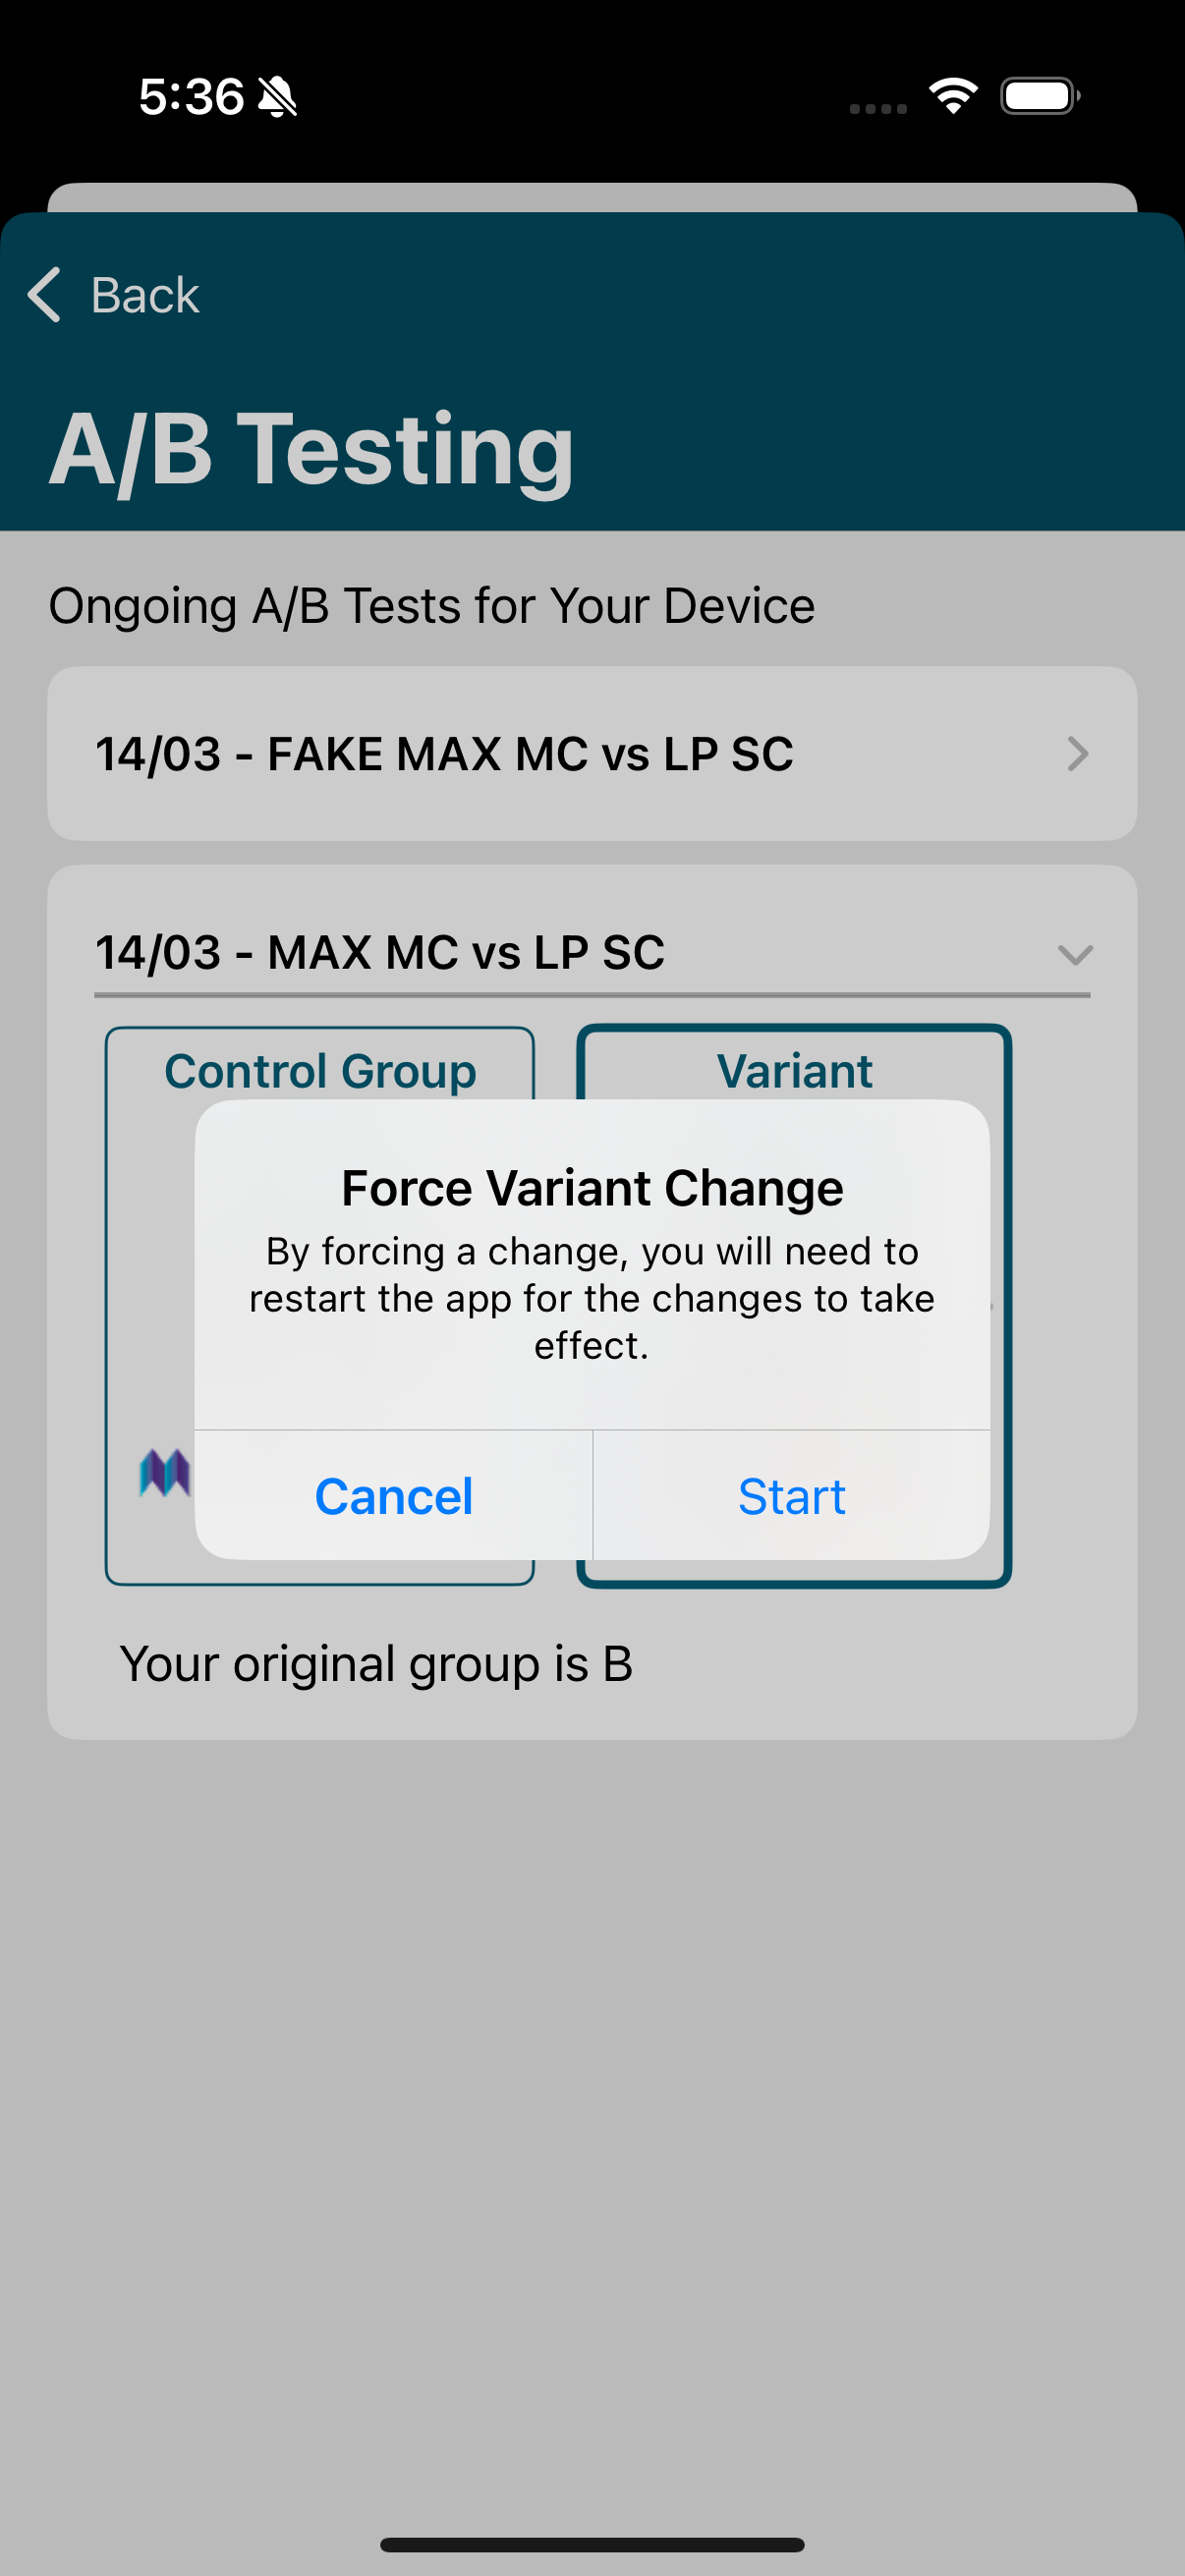
App restart is required for the A/B Testing forced strategy to work properly. This feature may not work as expected if this step is skipped.
After forcing the group, it will be visible on the main screen.
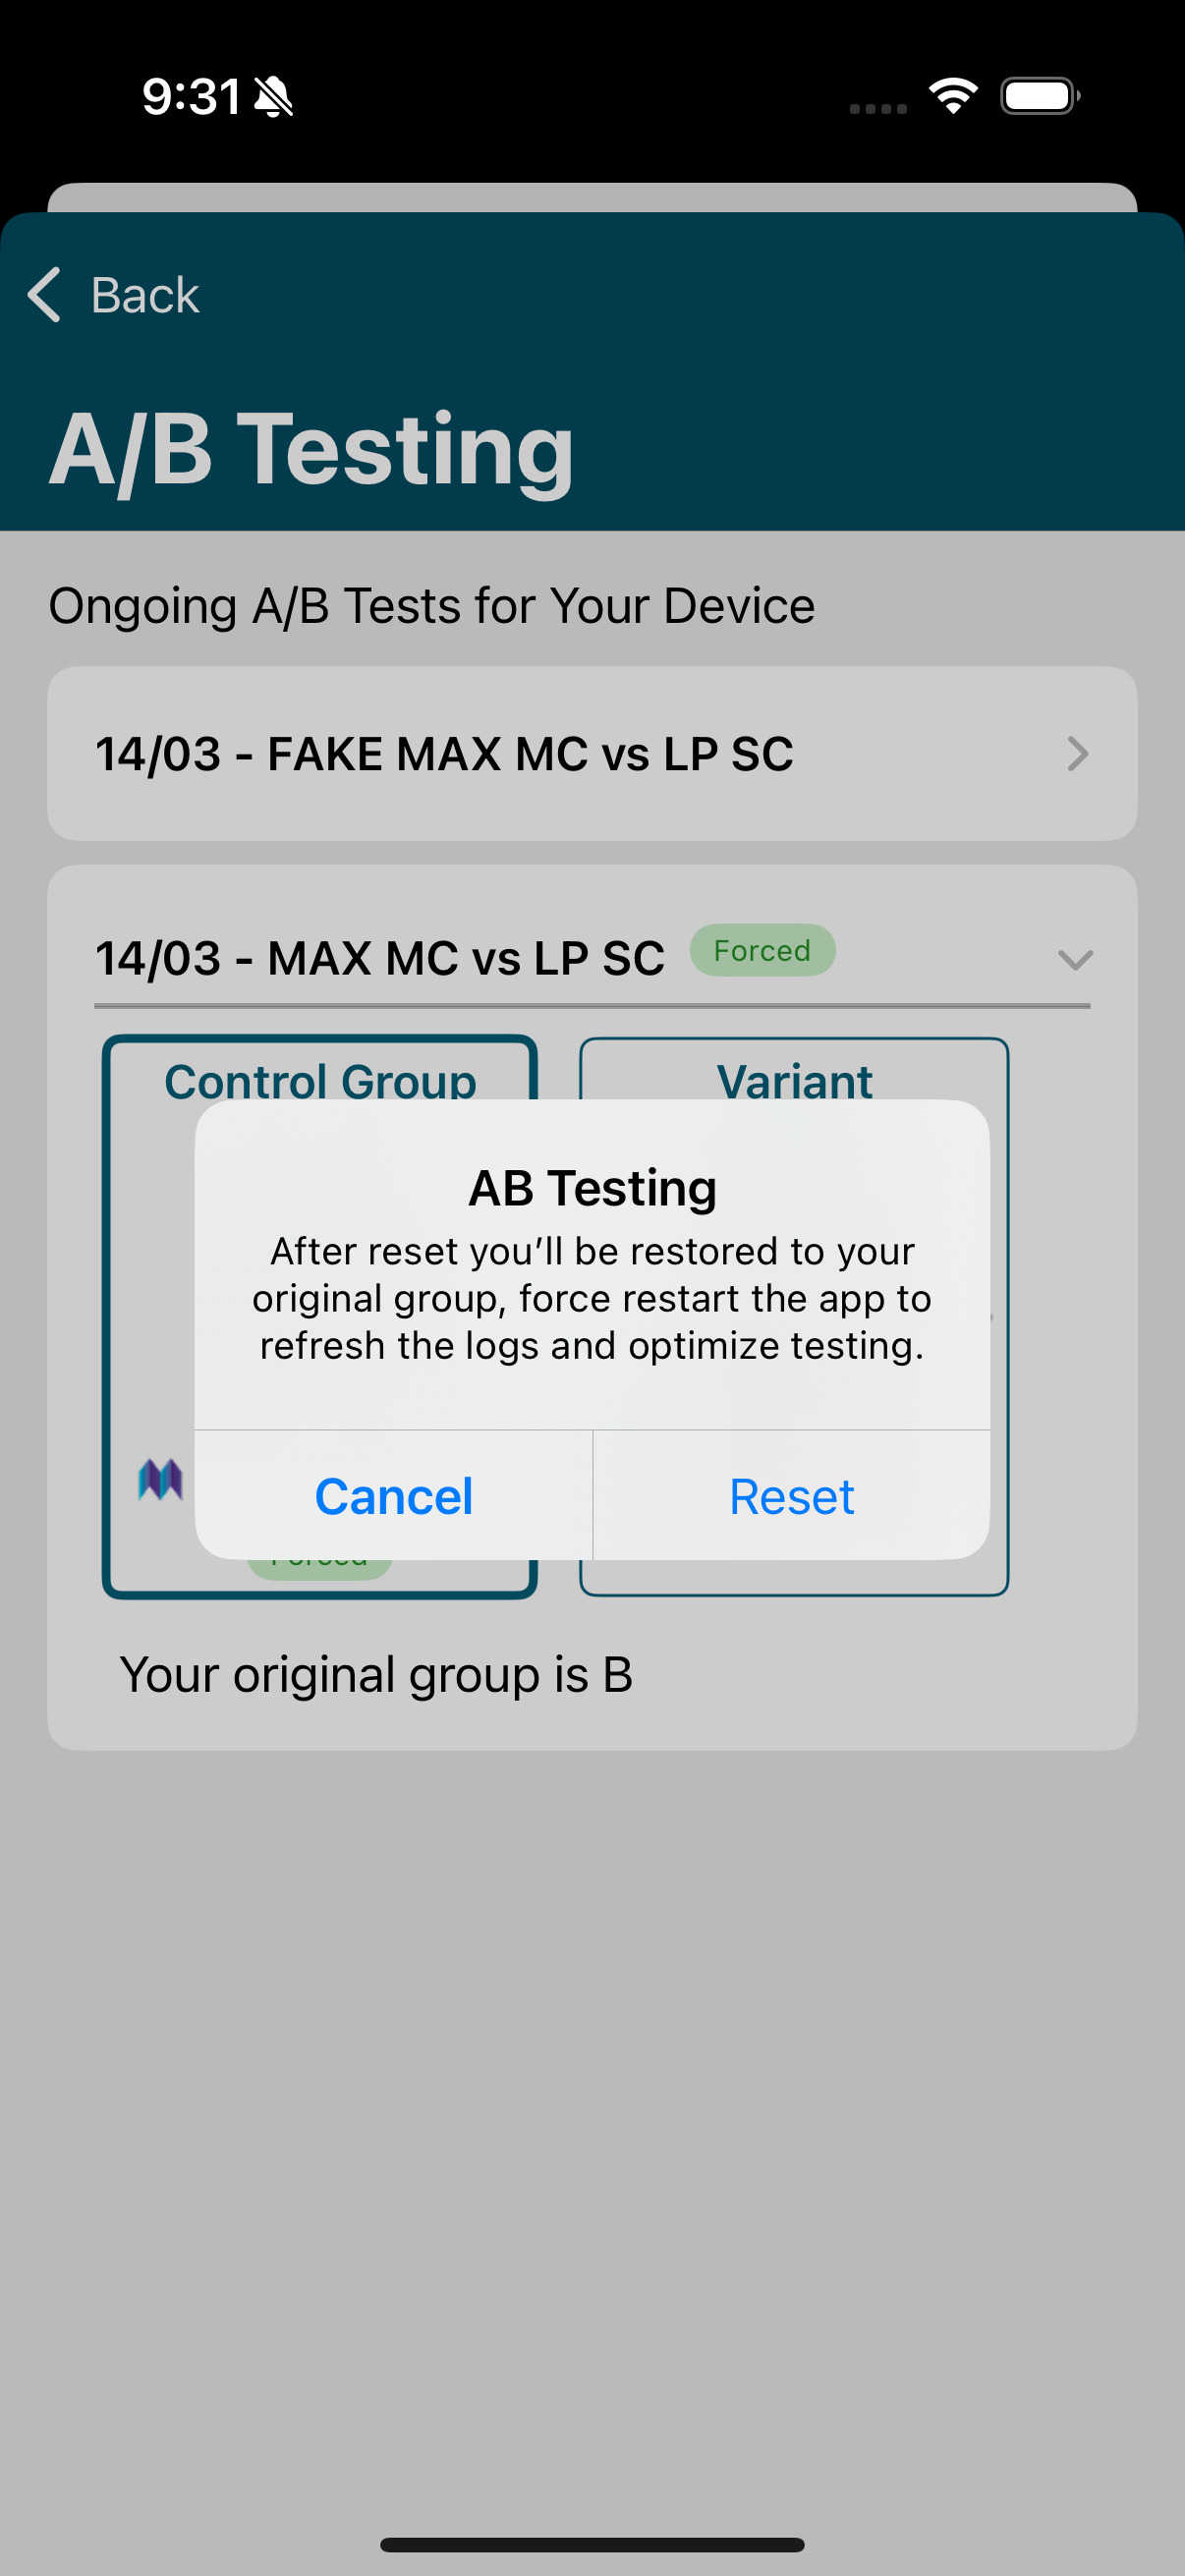
Loomit will now apply the strategy from the selected group. To reset and return to the default group, click on the forced group or restart from the main screen. A confirmation alert will appear.
Event Viewer
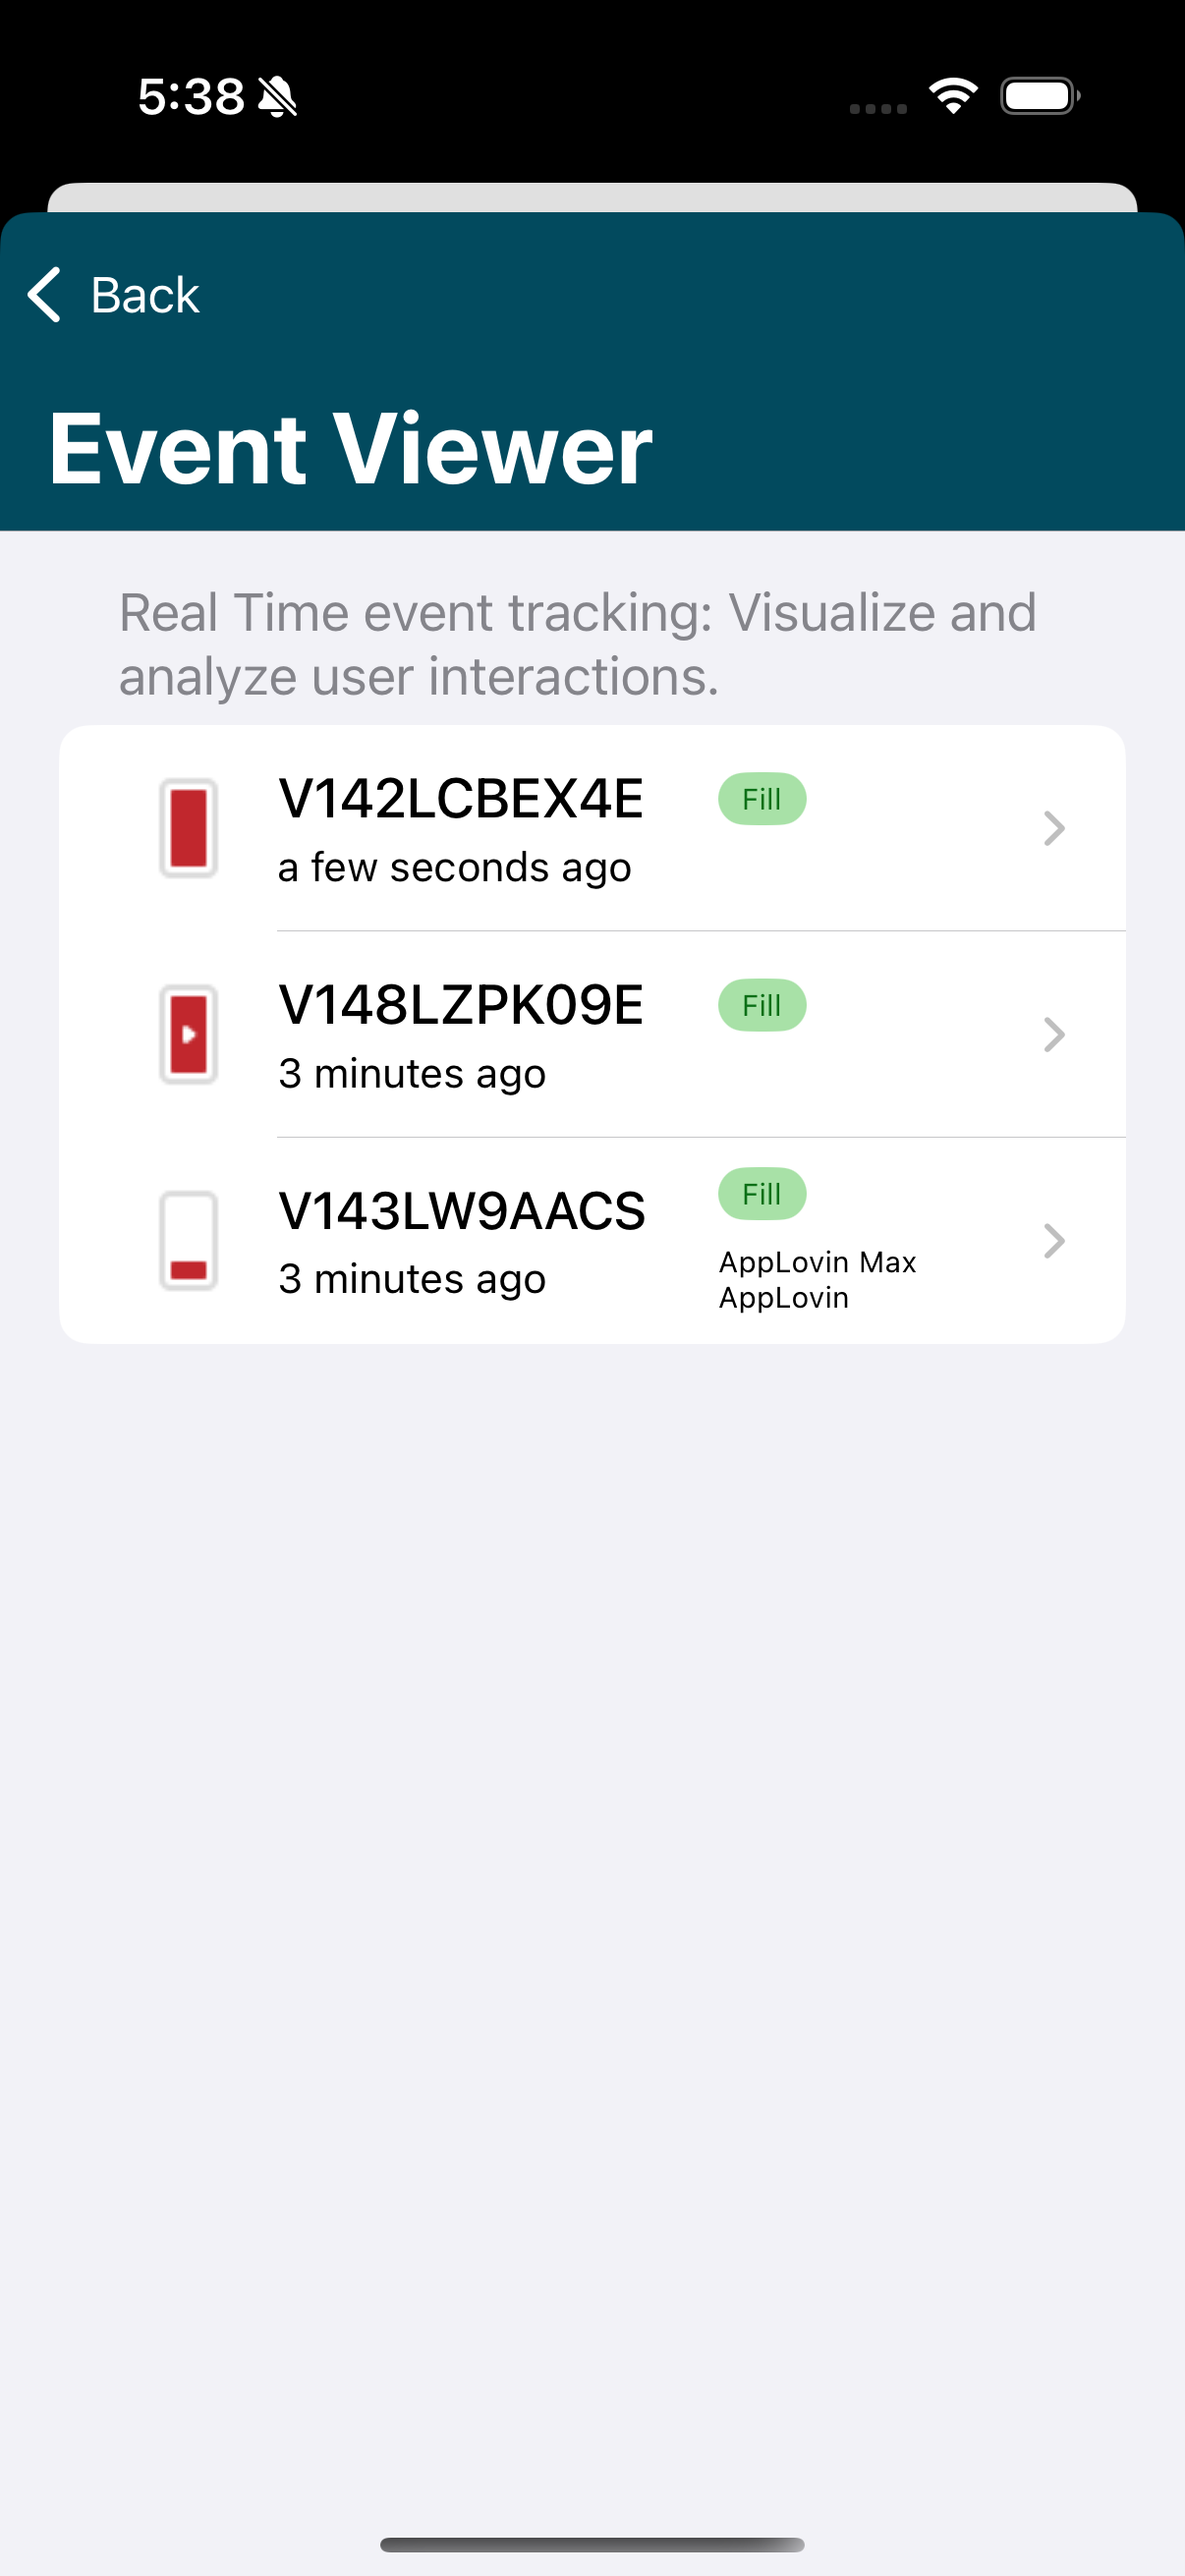
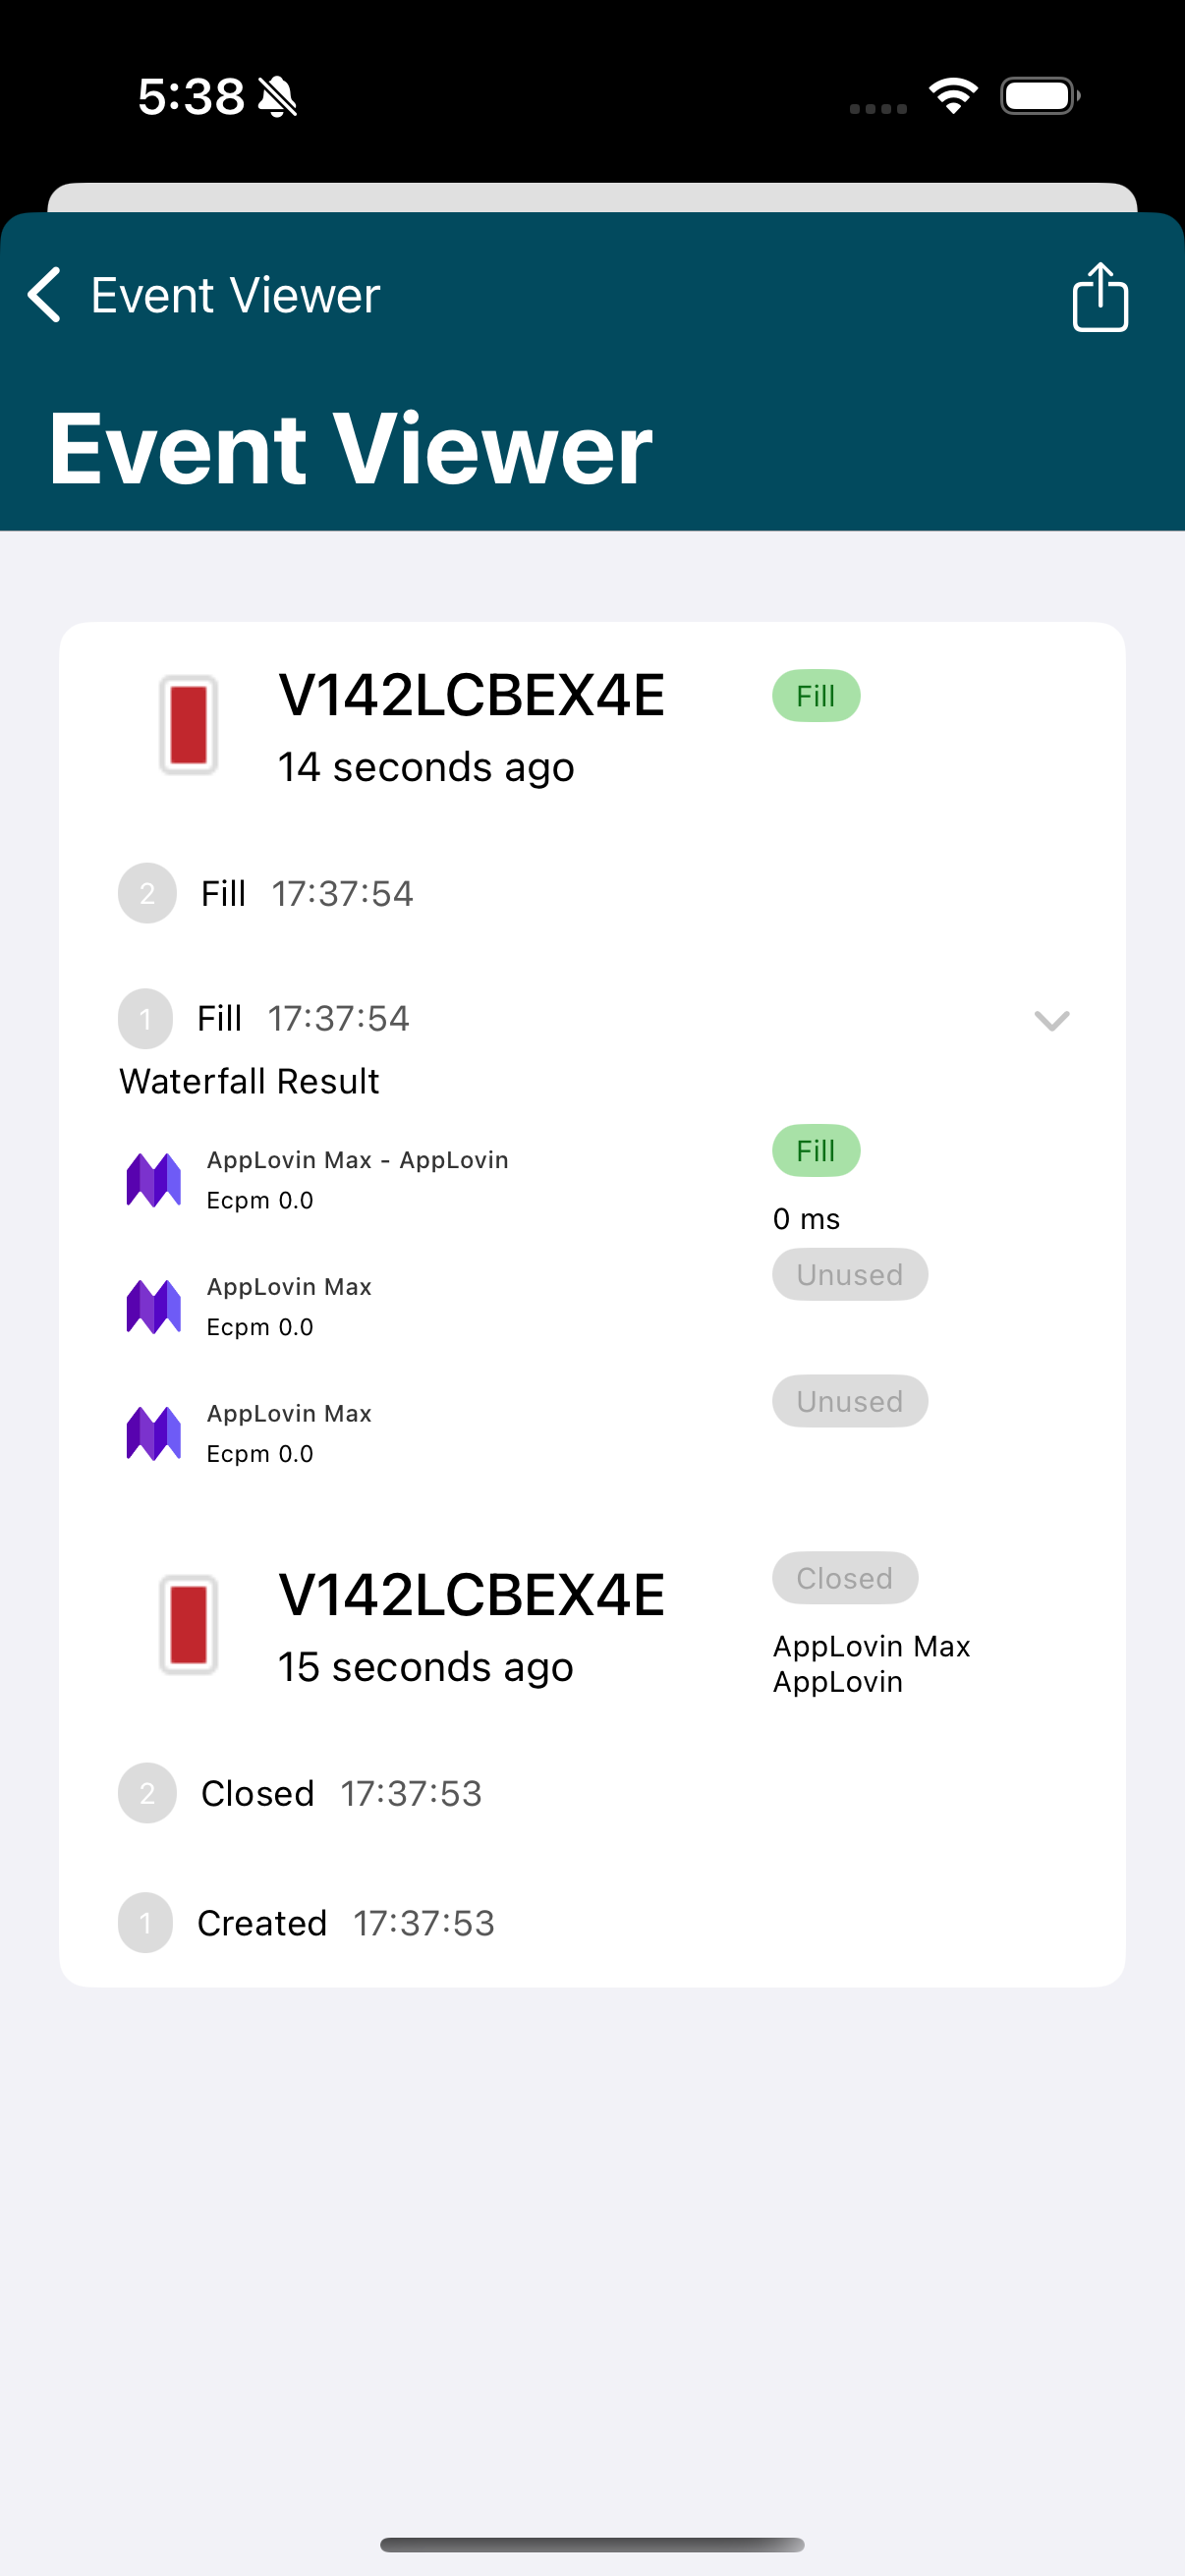
The Event Viewer feature provides real-time event tracking to visualize and analyze user interactions. With this feature, you can monitor the placement's events on a timeline and inspect the waterfall results.
The Event Viewer starts tracking user interactions the first time the Debugging Suite is opened or if the device is set as a Test Device in the admin settings.
Privacy Settings
The Privacy Settings feature provides an overview of the current privacy settings status in your application, showing information about the TCF, Google's Additional Consent (AC), CCPA strings, and child-directed flag.
If you're having problems viewing the privacy information, remember to follow the data privacy regulations guide to debug your integration.
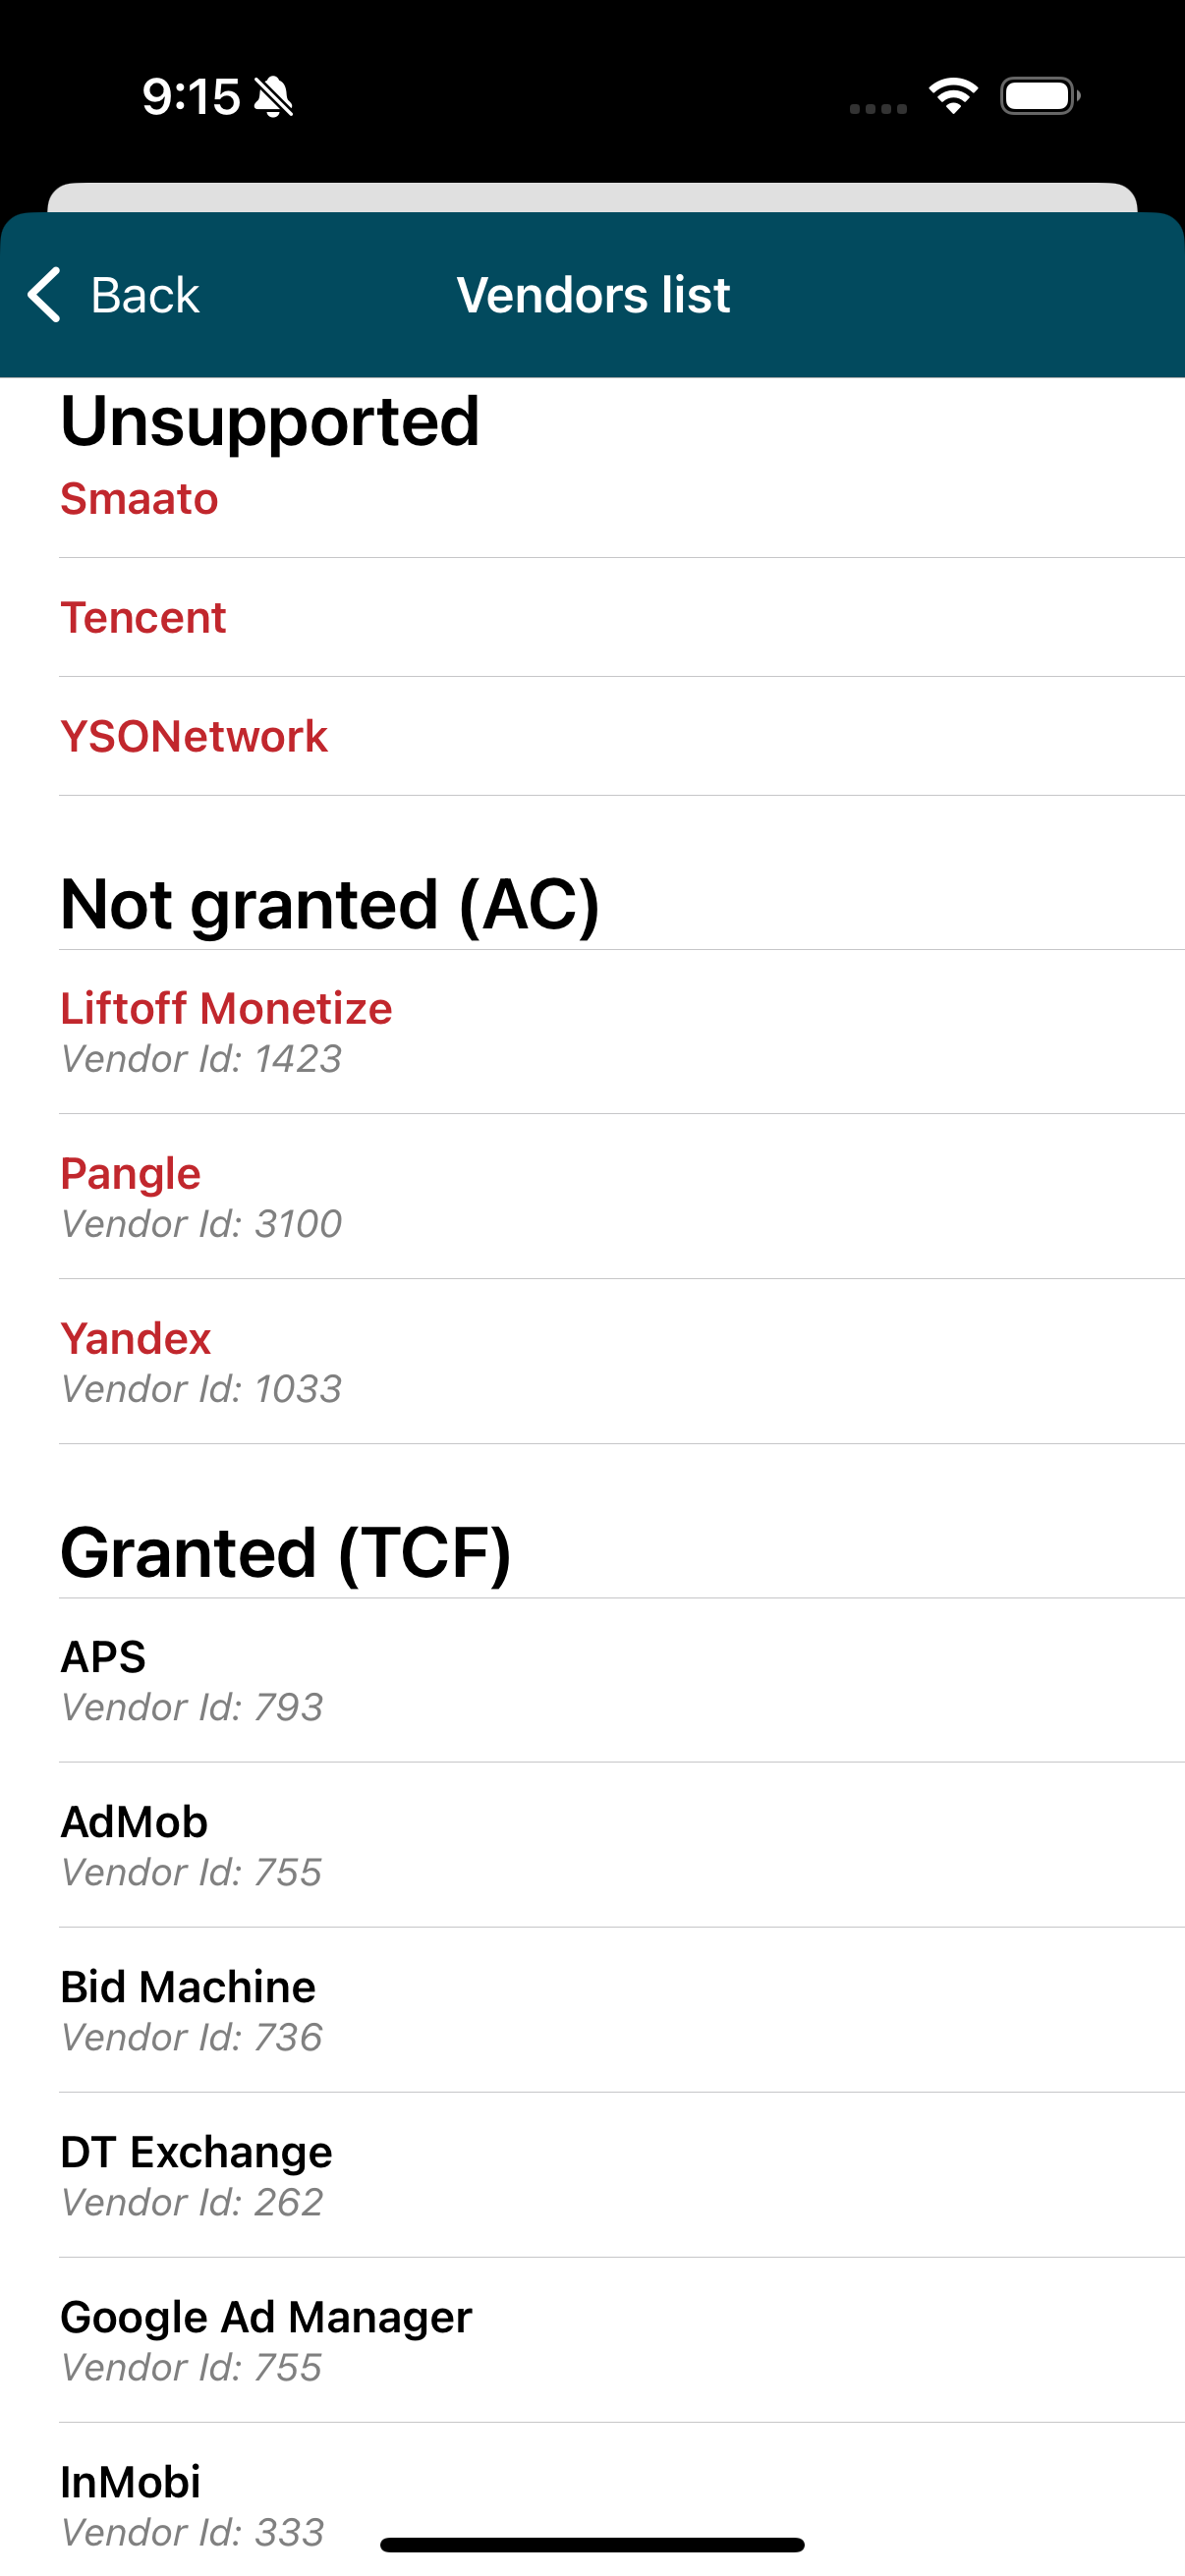
If GDPR is applicable and the consent was gathered using an IAB compliant CMP, under the CMP Integration section you can also view the status of the vendors that your application supports.
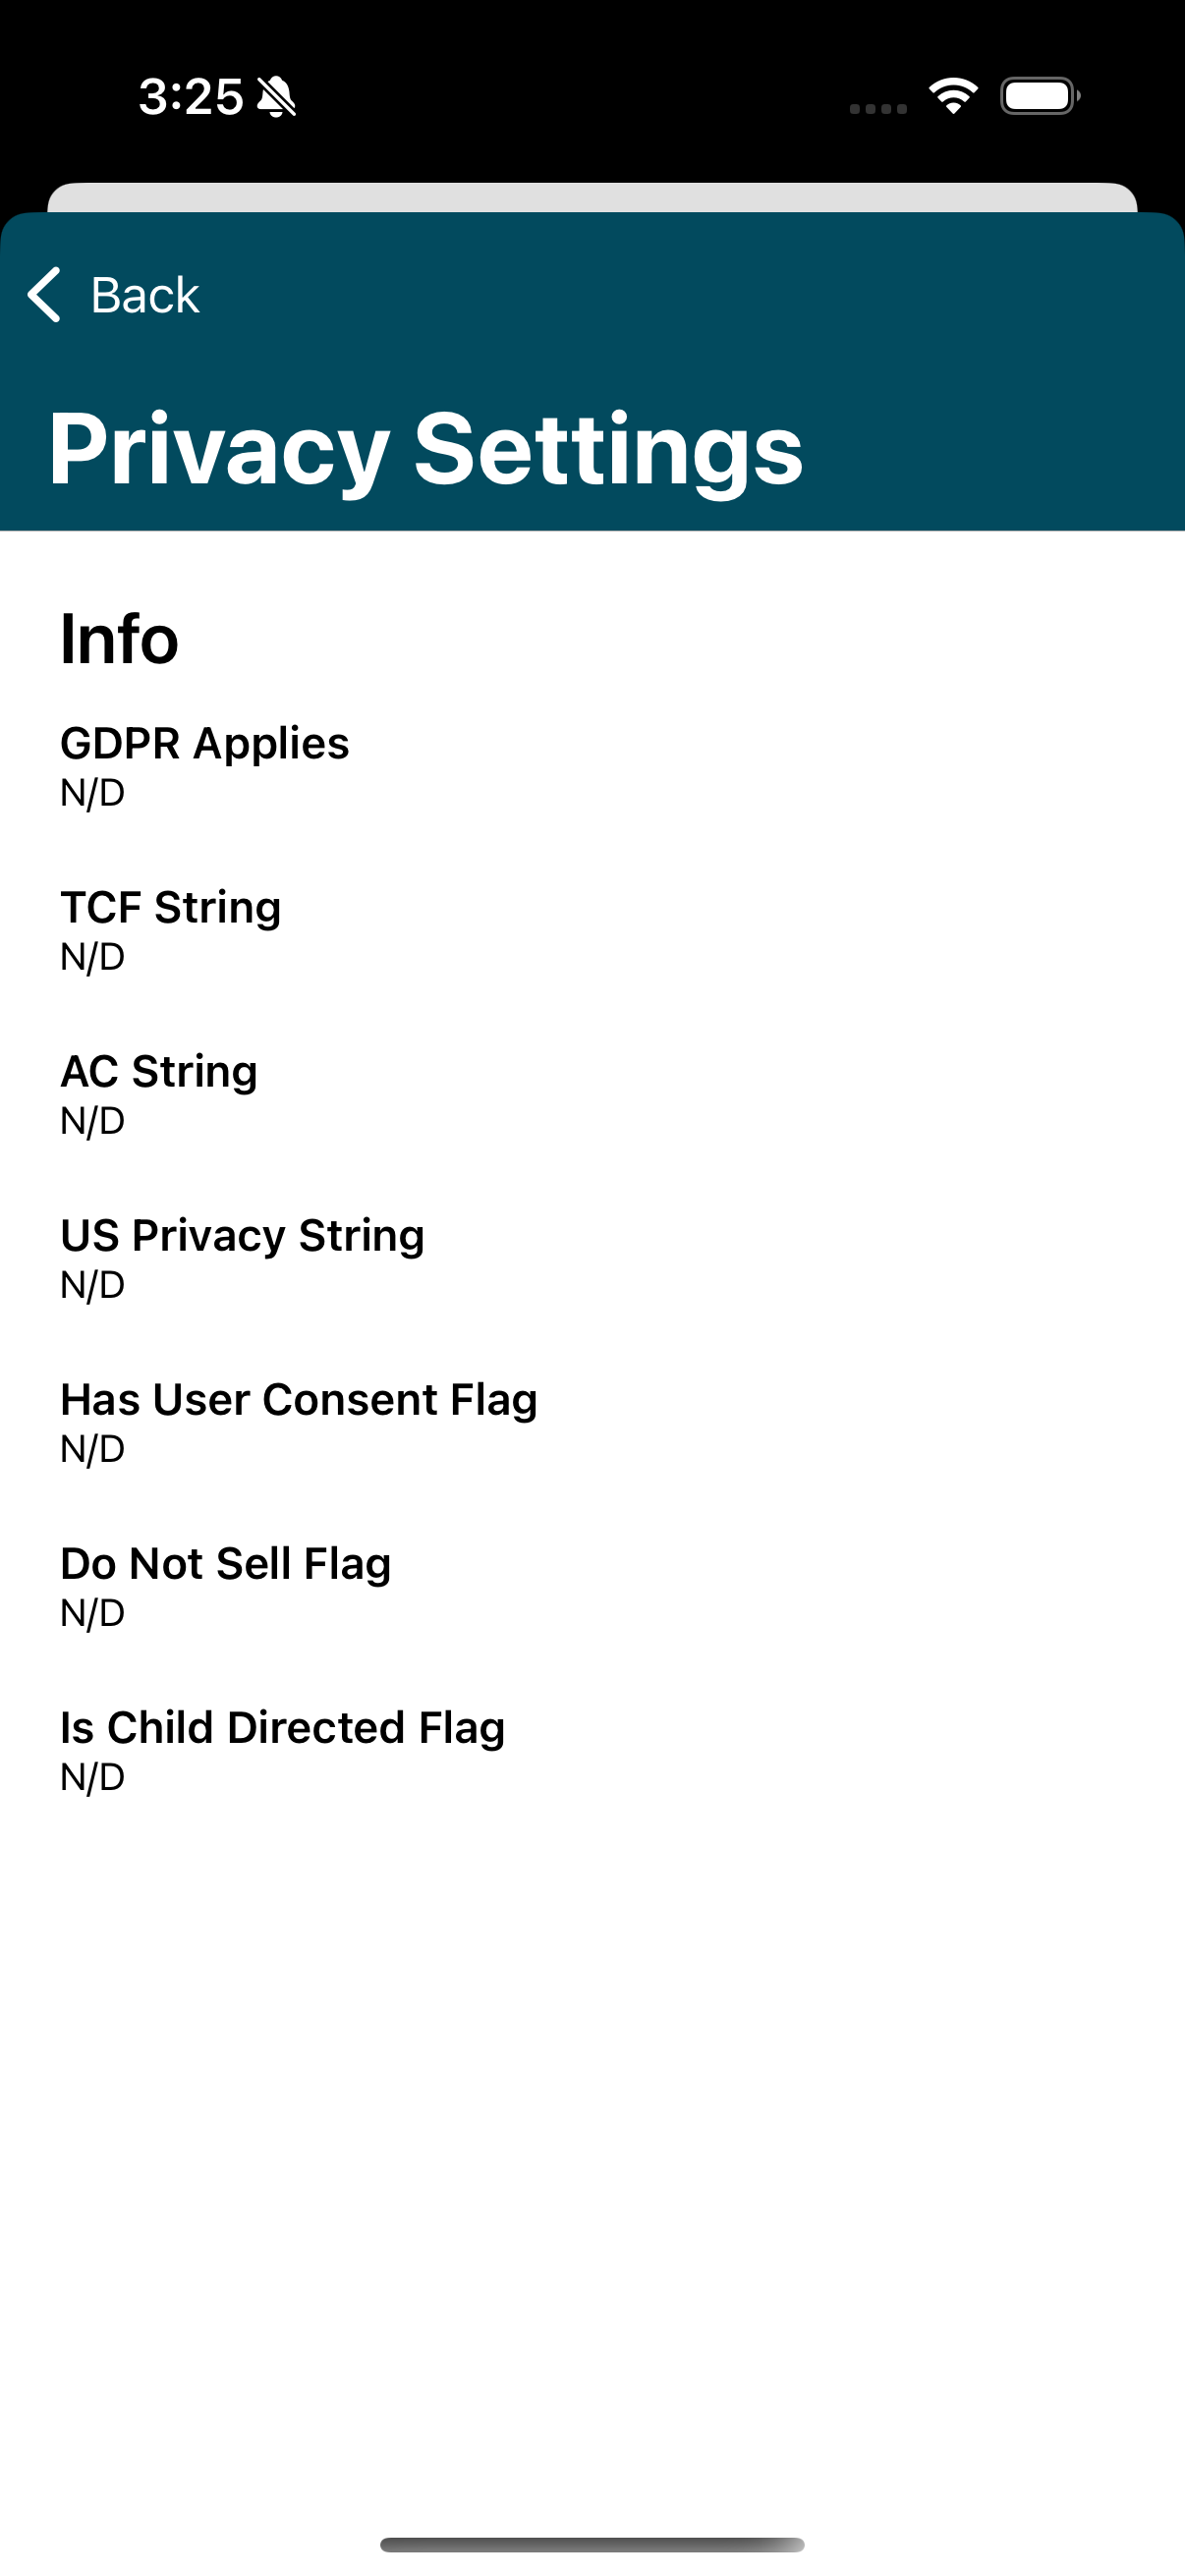
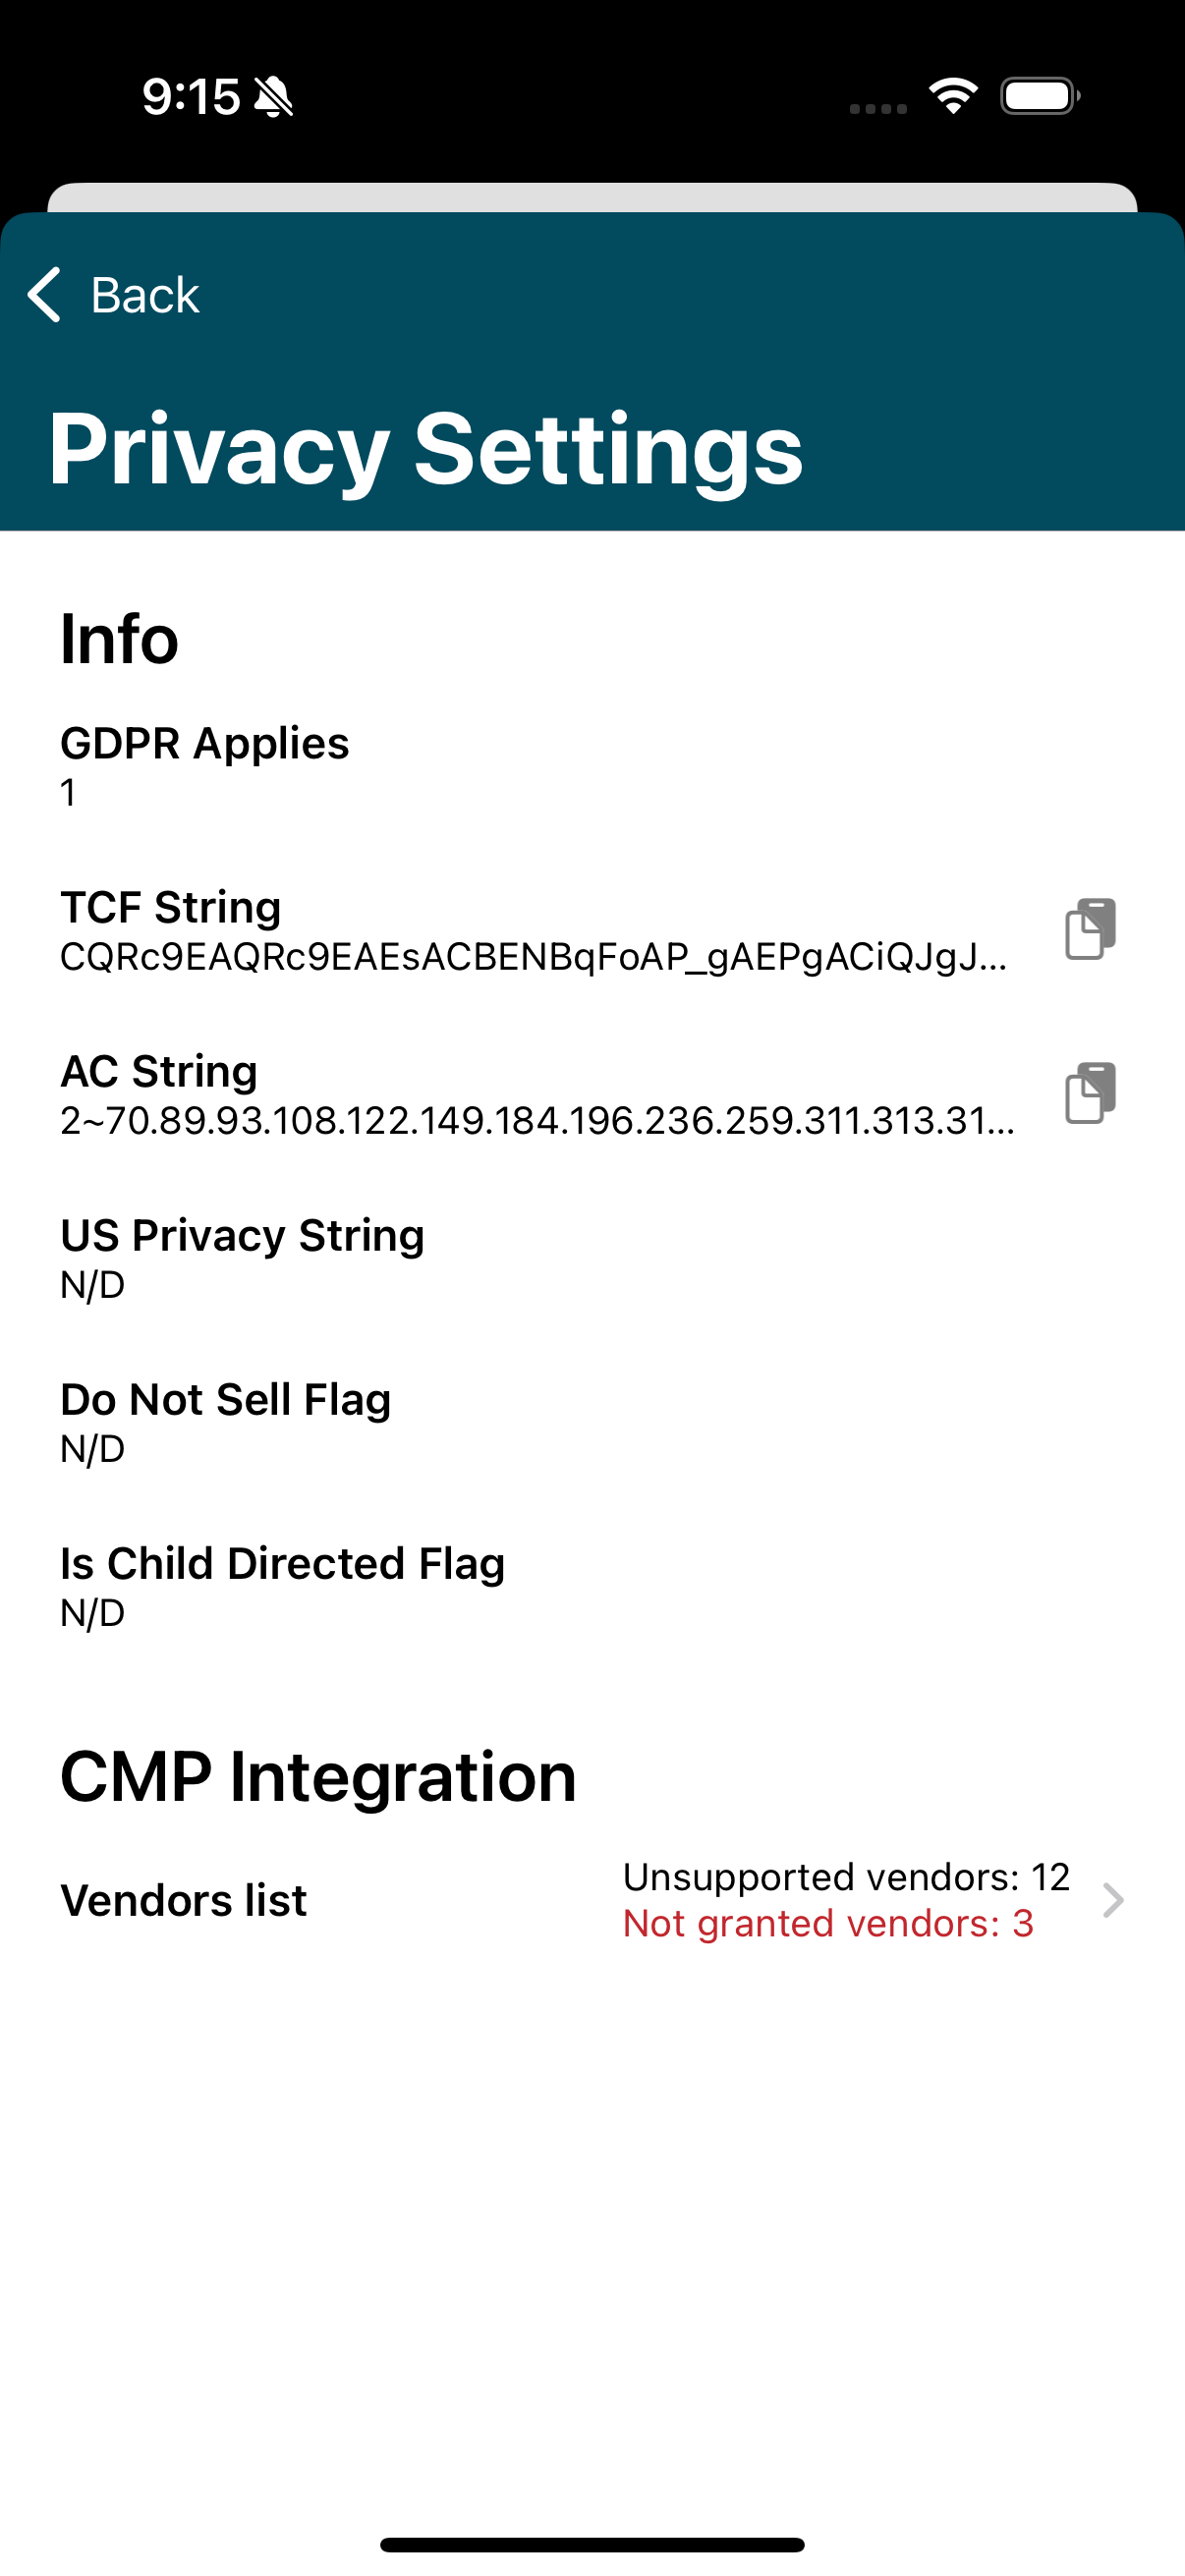
To check if a network is missing for your CMP integration, a detailed view of the consent status for each vendor is also available.